Hello! Welcome to the first lesson of our second module.
In the last module, you mastered the fundamentals of navigating Excel efficiently. We finished by learning how to use Freeze Panes and Split Windows to keep important information visible while working with large datasets. That was about improving how you view data. Today, we'll take the next crucial step: improving how you structure data.
As an MIS Executive, you will constantly receive raw data from various sources. Your job is to turn that raw data into reliable, structured information for reporting. The single most important tool for this job is the Excel Table. This lesson is dedicated to our learning outcome: to convert a raw data range into a structured Excel Table to enable dynamic features. This is the foundation upon which we will build all future trackers, reports, and dashboards.
1. From a Static Range to a Dynamic Table
So far, the data we've worked with has been in a "range"—a simple grid of cells. A range is static. If you build a chart or a summary formula based on a range like A1:E50, it will not automatically update if you add a new row of data at row 51. You would have to manually update all your formulas and chart sources. This is inefficient and a major source of errors in MIS reporting.
An Excel Table is a special container that tells Excel your data belongs together. By converting a range into a Table, you unlock powerful dynamic features that automate many of these manual tasks.
To get a quick overview of why this is so important, please read the first section of the following article.
HR Data Analysis in Excel: A Step-by-Step Guide
This article from AIHR gives a concise explanation of what Excel Tables are and why they are essential before starting any data analysis.
Read the section titled '1. Excel Tables'. Focus on the key benefits mentioned: preventing data scrambling, and enabling advanced filtering and slicing.
The key takeaway is that Tables turn your static data into a dynamic object that Excel can manage intelligently.
2. How to Create an Excel Table
Creating a Table is simple. The main prerequisite is that your data should be in a clean, tabular format with a unique header for each column, which is something you've already practiced.
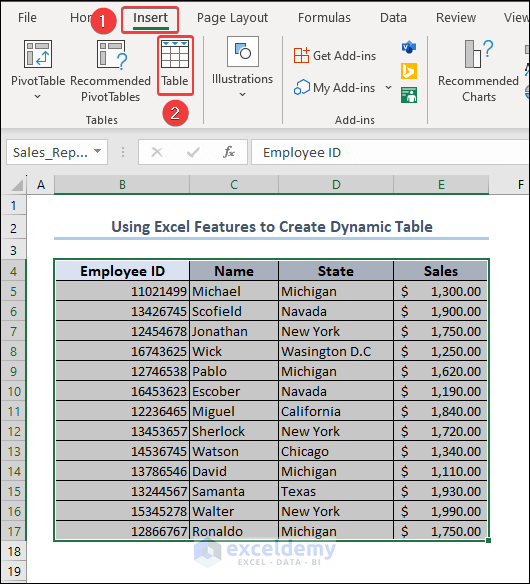
Let's watch a short video that demonstrates the most common ways to convert a data range into a Table.
7 Reasons Why you Should use Excel Tables
This video from Teacher's Tech clearly shows three different methods for creating a Table. It's a great practical demonstration.
Watch from the beginning to 02:00. Pay attention to the three methods shown: Format as Table (Home tab) Ctrl + T (Keyboard shortcut) Table (Insert tab) Also, notice the 'Create Table' dialog box where you confirm the data range and whether your data has headers.
The keyboard shortcut Ctrl + T is the method most professionals use because it's fast and efficient. Try to make it a habit.
Once you create a Table, a new Table Design tab appears on the ribbon whenever you click inside the Table. This is your command center for managing the Table.

3. The Power of "Dynamic Features"
Now for the most important part: understanding what makes a Table "dynamic." This is the core reason we use them. The following video provides an excellent demonstration of these features.
Only 1% of Excel Users Know Excel Tables! STAND OUT from the Crowd!
This video from MyOnlineTrainingHub is fantastic for understanding the 'magic' of Excel Tables. We'll focus on the sections that demonstrate the dynamic expansion and a few other key features.
Please watch these two segments carefully: Automatic Expansion (06:16 - 09:51): This is the most critical part. Observe how the Table automatically expands its formatting and range when new rows or columns are added. Notice how the table headers even take over the column letters (A, B, C...) as you scroll down, providing a built-in 'freeze pane' effect. Naming Your Table (01:25 - 02:27): Watch this section to learn why and how you should give your Table a meaningful name. This is a crucial best practice for making your formulas understandable later on.
To summarize the key dynamic features:
- Automatic Range Expansion: When you type or paste data in the row immediately below the Table, or the column immediately to its right, the Table automatically expands to include it. All formulas, charts, and PivotTables based on this Table will update instantly. This is the cornerstone of automated reporting.
- Easy, Consistent Formatting: You can apply or change professional formatting styles with a single click from the Table Design tab. The formatting also automatically extends to new rows.
- Intelligent Formula Fill-Down: In later lessons, when we write formulas in a Table column, they will automatically fill down to every row, ensuring consistency.
Hands-On Practice
Let's apply what you've learned. Your experience in recruitment involved tracking candidates, so we'll use a simplified version of that data.
- Open a new Excel workbook.
- Copy the data below and paste it into cell A1.
Candidate ID,Full Name,Position,Stage,Applied Date
C-001,Amit Kumar,Cyber Analyst,Interview,2024-05-01
C-002,Priya Sharma,Jr. Project Coordinator,Offer,2024-05-02
C-003,Rahul Verma,MIS Executive,Screening,2024-05-03
C-004,Sneha Patil,Cyber Analyst,Hired,2024-05-03
Now, let's turn this into a dynamic tracker.
Task 1: Convert to an Excel Table
- Click anywhere inside the data (e.g., cell B2).
- Press
Ctrl + T. - In the "Create Table" dialog box, ensure the range is correct (
=$A$1:$E$5) and the "My table has headers" box is checked. - Click OK. Your data is now a formatted Table with filter buttons.
Task 2: Name Your Table
- Click anywhere inside your new Table.
- Go to the Table Design tab that appears on the ribbon.
- In the "Table Name" box on the far left, replace the default name (like
Table1) with a descriptive name:Recruitment_Tracker. Press Enter. (Note: Table names cannot contain spaces).
Task 3: Witness the Dynamic Expansion
- Go to cell A6, which is the first cell directly below your Table.
- Type in the next Candidate ID:
C-005. Press Enter. - Notice how the Table automatically expands to include this new row, complete with the formatting. You can now fill in the rest of the data for this candidate:
Neha Singh, MIS Executive, Interview, 2024-05-04. - Now, go to cell F1, the first cell to the right of your Table. Type the header
Sourceand press Enter. - Again, the Table automatically expands to include this new column. You can now fill in the source for each candidate (e.g., LinkedIn, Naukri).
You've just experienced the primary benefit of Excel Tables. Any report or chart you build on Recruitment_Tracker will now automatically include new candidates and new data fields without any manual updates.
Summary of Key Takeaways
- A standard Excel range is static, while an Excel Table is a dynamic container for your data.
- To create a Table, click in your data and press
Ctrl + T. - Always give your tables a meaningful name via the Table Design tab.
- The key dynamic feature of a Table is its ability to automatically expand to include new rows and columns, which is essential for building automated reports.
Next Lesson
Fantastic! You now know how to properly structure data in Excel. This is a massive step forward and a skill that many Excel users overlook.
In our next lesson, we will leverage this new structure to write cleaner, more powerful formulas. You will learn how to use structured references to refer to Table data by name (e.g., Recruitment_Tracker[Stage]) instead of by cell addresses (e.g., D2:D6). This makes formulas much easier to read, write, and maintain.