Hello! Welcome to the ninth module of our course, "Creating Interactive Dashboards."
In the previous module, you did some excellent work building the engine for our reporting. You learned how to create a structured tracker, write formulas for KPIs like turnaround time, build summary tables for trend analysis, and most recently, how to reconcile your data to ensure its accuracy. You now have all the calculated, validated components ready. The next logical step is to present them in a clear, professional, and useful way.
This lesson marks the beginning of that process. Our learning outcome is to plan a one-page dashboard layout to display KPIs, summary tables, and charts.
Think of yourself as an architect. Before construction begins, you need a blueprint. In MIS, planning your dashboard layout is creating that blueprint. It saves a tremendous amount of time and ensures the final product is effective and easy for stakeholders to understand. Your experience in structured, deadline-driven environments will make the value of this planning phase immediately clear.
1. What is a Dashboard and Why Do We Plan It?
First, let's establish a clear definition. An Excel dashboard is a single-screen visual tool that tracks, analyzes, and displays key performance indicators (KPIs) and other important data points. Its purpose is to turn raw data into insights at a glance.
Before you even think about what your dashboard will look like, you must answer two questions:
- Who is the audience? (e.g., A department head, a project manager, an operations team?)
- What key questions does the dashboard need to answer? (e.g., "How many incidents are open?", "What is our performance trend this month?")
Your answers will guide every decision you make. For our Incident Management dashboard, the audience is likely an operations manager, and the questions revolve around incident status, severity, and resolution times.
The following article gives a great overview of dashboard best practices. Pay close attention to the principles of simplicity and organization.
How to create a dashboard in Excel that will help you stay on track
Please read the following sections from the article 'How to create an Excel dashboard' to understand the core purpose and best practices of dashboard design.
Read the sections 'What is an Excel dashboard?' and '5 Excel dashboard best practices'. Focus on the advice to 'Keep it simple' and 'Organize the layout and use the same style'.
2. The Art of the Layout: Wireframing
The best way to plan your layout is to create a wireframe. This is a simple, low-fidelity sketch of the dashboard's structure. You can do this with a pen and paper or by using basic shapes in Excel. The goal is to decide where each element will go before you build it.
This video demonstrates the wireframing process perfectly.
Create interactive excel dashboard in 5 simple steps #exceldashboard #exceltutorial #pivottable
Watch this segment to see how a dashboard designer sketches out a wireframe and then lists the specific data points needed for each section. This is the exact process we will follow.
Watch from 01:51 to 06:18. Observe how the creator first draws boxes for the logo, KPI cards, tables, and charts. Then, notice how they define exactly what metric or visual will go into each of those boxes.
As you saw, the process is straightforward:
- Sketch the main blocks: Where will the title go? The KPIs? The charts? The filters (slicers)?
- Label each block: What specific information will each block contain?
A common and highly effective layout structure is:
- Top: Title and interactive controls (Slicers, dropdowns).
- Top-Left/Upper Section: High-level Key Performance Indicators (KPIs). This is where the eye naturally goes first. These are your most critical numbers (e.g., Total Open Incidents).
- Middle Section: Charts and graphs that provide trends and comparisons (e.g., Incidents by Severity, Incidents over Time).
- Bottom Section: Detailed data in tables, if necessary (e.g., list of top 5 oldest open incidents).
Let's look at a couple of examples relevant to your work.

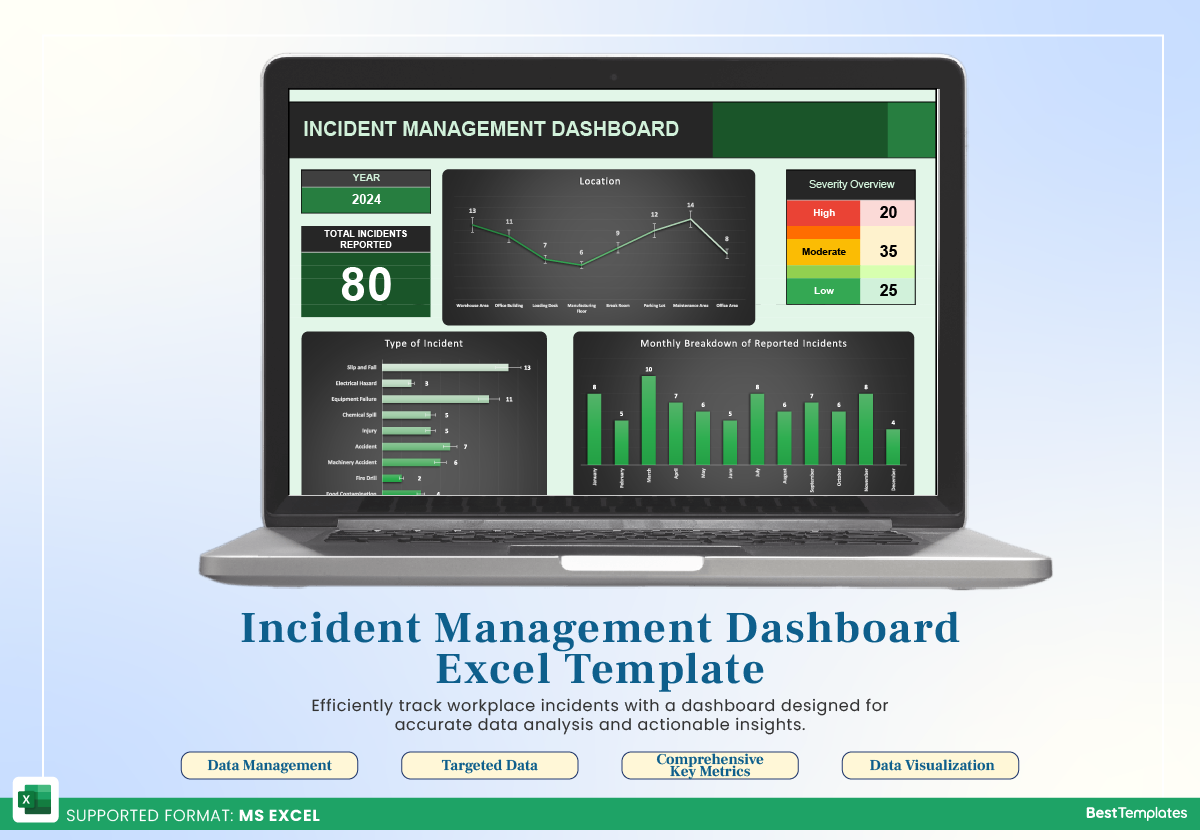
3. Key Principles for a Professional Layout
Creating a clean, professional dashboard goes beyond just placing elements on a page. It requires attention to design principles.
This article provides excellent, concise tips on creating visual consistency.
Build This Beautiful Sales Dashboard in Excel | Step-by-Step for Beginners
This article offers practical advice on layout and visual consistency. These principles are what separate a basic report from a professional dashboard.
Please read the sections titled 'Recommended Layout Structure' and 'Visual Consistency Tips'. Pay attention to the use of a grid, consistent fonts and colors, and using whitespace to avoid a cluttered look.
The key takeaways for a professional layout are:
- Alignment is crucial: Align all your charts and cards to a grid. Use the
Aligntools in Excel'sShape Formattab to ensure objects are perfectly lined up. - Use whitespace: Don't cram elements together. Leaving space around charts and tables makes the dashboard easier to read.
- Be consistent: Use the same font family and a limited color palette (2-3 main colors) throughout the dashboard. This creates a cohesive, professional look.
4. Your Turn: Plan Your Incident Management Dashboard
Now it's time to apply these concepts. Using your Incident_Tracker.xlsx file as the source, you will create a plan for your own one-page dashboard. You don't need to build anything yet—just create the blueprint.
Your Task:
Open a new, blank Excel sheet (or use pen and paper). Sketch a wireframe for your Incident Management Dashboard.
Follow these steps:
- Define the Purpose: Your goal is to give a manager a clear overview of the current incident situation.
- Sketch the Layout: Draw boxes for the different sections. I recommend the following structure:
- A title at the top.
- A row of 4 KPI cards below the title.
- A section for 2-3 main charts in the middle.
- A space for slicers (filters) on the left or top.
- Specify the Components: For each box in your wireframe, decide what data it will show. Here are some suggestions based on your tracker:
- KPI Cards (Top Section):
- Total Incidents
- Open Incidents
- Average Resolution Time (in days)
- Number of "High" Severity Incidents
- Charts (Middle Section):
- A pie or donut chart showing Incidents by Status (Open, Closed, In Progress).
- A bar chart showing Incident Count by Assigned Department.
- A line chart showing the number of Incidents Reported over Time (by month or week).
- Slicers (Filters):
- Filter by Severity.
- Filter by Status.
- KPI Cards (Top Section):
This planning exercise is the most critical step in building a great dashboard. A good plan now will make the upcoming building process smooth and efficient.
Conclusion
In this lesson, you've learned the importance of planning and the principles behind a well-structured dashboard. You are now equipped to design a layout that is not only visually appealing but, more importantly, functional and insightful for your end-users.
Key Takeaways:
- Plan Before You Build: Always start with a wireframe to define the purpose, audience, and layout of your dashboard.
- Structure is Key: Place the most important information (KPIs) at the top and arrange other elements in a logical, grid-aligned flow.
- Design for Clarity: Use consistency in fonts and colors, and leverage whitespace to create a clean, professional, and easy-to-read report.
You now have a blueprint for your Incident Management dashboard. In our next lesson, we will begin the construction phase. You'll learn how to link dashboard charts and KPI text boxes to the dynamic summary/calculation sheet you've already built, bringing your plan to life with live data.