Hello! Welcome to the next stage of our journey.
In the last module, you did an excellent job mastering PivotTables to summarize vast amounts of data and even create custom metrics with Calculated Fields. Now, it's time to bring those summaries to life. An MIS report isn't just about numbers in a table; it's about communicating insights clearly and quickly. This is where data visualization comes in.
Today's lesson addresses the first learning outcome in our "Visualizing Data with Charts" module: Create bar, column, and line charts from summary data. These three chart types are the workhorses of business reporting. Mastering them will allow you to transform the tables you create into powerful visual stories that managers and stakeholders can understand in seconds.
When to Use Which Chart?
Before we start creating charts, it's essential to know which type to choose for your data. The choice depends on the story you want to tell.
- Column or Bar Charts: Use these to compare values across different categories. For example, comparing sales figures for different products, or the number of incidents handled by different team members. A column chart uses vertical bars, while a bar chart uses horizontal bars (often better if you have long category names).
- Line Charts: Use these to show a trend over a continuous period, like days, months, or years. This is perfect for tracking revenue over time, monitoring website traffic, or seeing the number of open support tickets throughout a quarter.
10 types of Excel charts for data visualization
To solidify these concepts, please read the brief descriptions of bar, column, and line charts in this article from the Journal of Accountancy. It provides a concise, professional overview.
Read the sections titled 'BAR AND COLUMN CHARTS' and 'LINE CHARTS'. Focus on the key use case described for each chart type.
Creating Your First Charts
The fundamental process of creating any chart in Excel is simple: select your data, then choose a chart type from the Insert tab.
Let's watch a detailed walkthrough that covers creating the most common charts from a simple data table. This video is packed with practical tips that will help you work more efficiently.
Excel Charts and Graphs Tutorial
Kevin Stratvert's tutorial is an excellent guide to the basics of chart creation. It covers selecting data, using Excel's recommendations, and some great shortcuts.
Watch from 00:53 to 07:50. Pay close attention to these key points: Data Selection (1:05): Notice how the total row is excluded. Including totals will skew your chart and make the individual data points unreadable. Recommended Charts (1:45): This is a great starting point if you're unsure which chart type is best. Shortcuts (6:15): The Alt+F1 (chart on the same sheet) and F11 (chart on a new sheet) shortcuts are extremely useful for MIS professionals who create reports regularly.
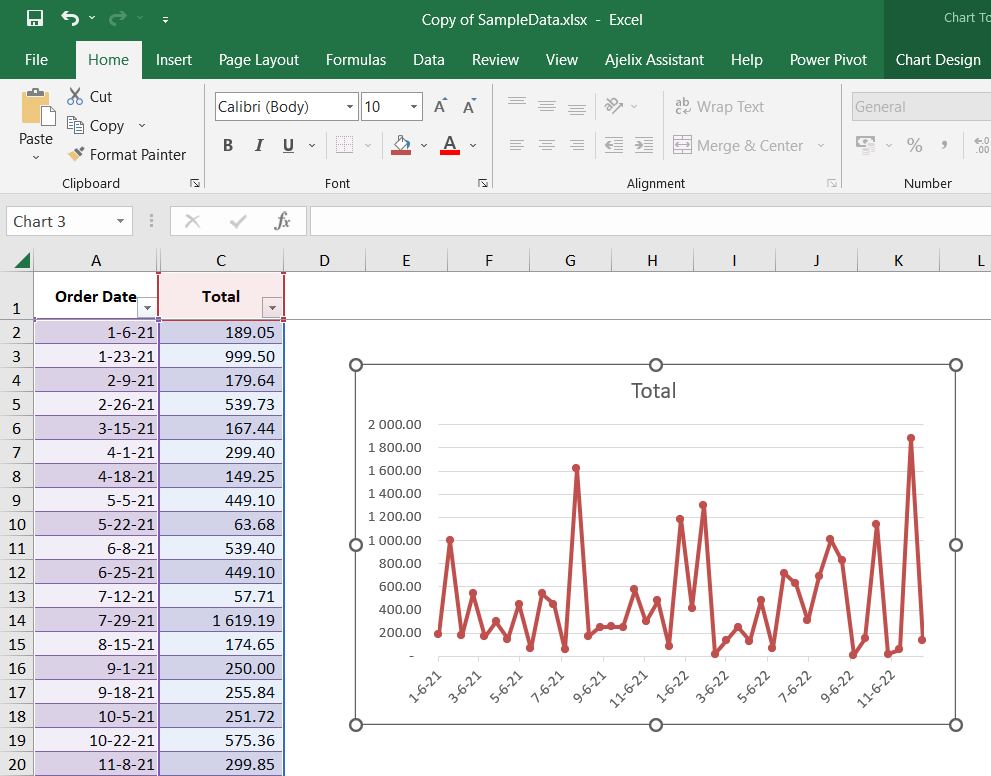
As you saw, creating a basic chart takes only a few clicks.

From Data to Professional Visualization
A default Excel chart is a good start, but for a professional MIS report, you need to refine it. A well-formatted chart is clean, easy to read, and directs the viewer's attention to the key message. This means adding clear titles, labeling your axes, and removing unnecessary clutter.
This next video segment focuses on exactly that—transforming a basic chart into a polished, presentation-ready visual.
Excel Charts and Graphs Tutorial
Let's continue with Kevin Stratvert's tutorial to learn about essential formatting techniques.
Watch from 07:45 to 13:01. Focus on these practical formatting steps: Dynamic Chart Titles (8:35): Linking your chart title to a cell is a fantastic trick. It ensures your title updates automatically if the source data or report header changes. Axis Titles (9:20): Always label your axes. No one should have to guess what the numbers or categories represent. Styles and Colors (11:00): Use color purposefully. Sticking to a simple, clean color palette is more professional than using the default Excel multi-color schemes.
A few key formatting principles to always remember:
- Give it a title: The title should clearly state what the chart is showing.
- Label the axes: Ensure the vertical (Y-axis) and horizontal (X-axis) are labeled so the units and categories are clear.
- Add data labels: Sometimes it's helpful to show the exact value of each bar or point.
- Remove clutter: Delete unnecessary elements like gridlines or redundant legends if they don't add value.
Your Turn: Create and Format Charts
Now, let's put this into practice. Please use the sample-data-for-pivot-table.xlsx file.
Scenario: You need to create two visuals for a weekly sales report.
Task 1: Create a Column Chart for Sales by Category
- First, create a summary of the data. On a new sheet, create a simple PivotTable showing the total
Salesfor eachCategory. - Select the data in your PivotTable (the categories and their sales totals).
- Insert a Clustered Column Chart (
Insert>Charts>Column). - Format the chart:
- Change the chart title to "Total Sales by Product Category".
- Add a title to the vertical axis called "Total Sales ($)".
- Right-click the bars and select "Add Data Labels" to show the sales values on each column.
- Click on the horizontal gridlines and press
Deleteto remove them for a cleaner look.
Task 2: Create a Line Chart for Sales Over Time
- Create another PivotTable. This time, put
OrderDatein the Rows area andSalesin the Values area. - Group the dates: Right-click on any date in the PivotTable and select
Group. In the dialog box, make sure only Months is selected and click OK. - Select your new summary data (Months and Sales).
- Insert a Line with Markers chart (
Insert>Charts>Line). - Format the chart:
- Change the chart title to "Monthly Sales Trend".
- Add an axis title for the vertical axis: "Total Sales ($)".
- Ensure the chart is easy to read. Adjust colors or line styles if you wish.
Take your time with the formatting. The goal is to produce a chart that you would be confident including in a report for your manager.
Conclusion
Great work today! You've learned how to take summary data and turn it into the three most fundamental chart types used in business: bar, column, and line charts. More importantly, you've learned that creating the chart is just the first step; formatting it for clarity and impact is what truly adds value.
Key Takeaways:
- Choose the right tool: Use column/bar charts for comparing categories and line charts for showing trends over time.
- Start with good data: Your chart is only as good as the summary data it's based on. Always exclude totals from your selection.
- Format for clarity: A professional chart has a clear title, labeled axes, and is free of clutter. Use formatting to tell a story, not to distract.
- Practice shortcuts: Using
Alt+F1will make you much faster at creating reports.
In our next lesson, we will build directly on today's skills. We'll explore how to create combination charts to visualize two different types of data at once (like sales columns and a profit margin line) and how to create PivotCharts, which are charts that are dynamically linked to your PivotTables.