Hello! Welcome back to our module on summarizing data with PivotTables.
In our last lesson, you learned how to configure the four field areas (Rows, Columns, Values, Filters) and change the summary calculation from Sum to Count or Average. You built reports that answered questions like "What was the average sale per region?" or "How many transactions did each salesperson have?".
Today, we'll add another powerful technique to your toolkit: grouping. A raw list of dates or numbers in a report is often too detailed to be useful. For an MIS report, you need to see the bigger picture—trends over time or patterns within data segments. This lesson will teach you how to roll up granular data into meaningful categories.
By the end of this lesson, you will be able to group PivotTable data by date (Year, Month, Week) and by numeric ranges. This is a fundamental skill for creating trend analysis reports, aging reports, and frequency distributions.
Grouping Data by Date
Imagine you have a list of daily sales data for the past two years. A PivotTable showing sales for each individual day would be hundreds of rows long and difficult to interpret. The real insights come from seeing how sales trend from month to month or quarter to quarter. This is where date grouping is essential.
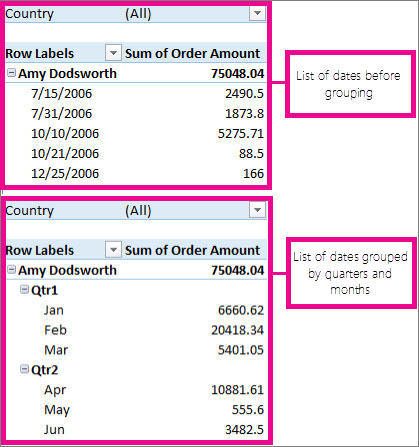
Let's see how this is done.
3 PivotTable Grouping Tricks to Summarize Data FAST!
This first video provides a quick and clear demonstration of how Excel can automatically group dates and how you can customize this grouping. It's the fastest way to get a feel for the feature.
Watch from 2:39 to 4:13. Pay attention to how right-clicking a date field opens the 'Group' dialog, and how you can select multiple time periods like Years, Quarters, and Months to create a hierarchy for drill-down analysis.
The video showed the core mechanic, but there are some important details to master, especially when dealing with different timeframes like weeks. This article provides very clear, step-by-step instructions for the most common scenarios.
How to Group Dates in Pivot Tables in Excel
To make sure your reports are accurate and easy to read, it's important to understand the nuances of date grouping. This article from TrumpExcel covers key details, including the correct way to group by weeks.
Please read the following sections: 'Grouping by Quarters in a Pivot Table': Focus on the part that explains why it's crucial to group by both Quarters and Years together to avoid incorrectly summing data from different years. 'Grouping by Months in a Pivot Table': This reinforces the concept of combining time periods. 'Grouping by Weeks in a Pivot Table': This is a key technique for weekly reporting. Note that you have to select 'Days' and then specify the number of days as 7. 'How to Ungroup Dates...': A quick look at how to reverse the process.
Key Takeaways for Date Grouping:
- How to Group: Place your date field in the Rows or Columns area, right-click any date, and select Group.
- Combine Periods: For accurate trend analysis, always group by a larger period (like Years) along with a smaller one (like Months or Quarters). This creates separate, correct summaries for each year.
- Weekly Grouping: To group by week, select only Days in the grouping dialog and set the 'Number of days' to 7. You can also set a specific 'Starting at' date to ensure your weeks start on a Monday, for example.
Grouping Data by Numeric Ranges
The same grouping principle applies to numbers. This is incredibly useful for segmenting data. For instance, in your cybersecurity role, you might have incident data with a "Days to Resolution" column. Instead of looking at each individual number (1, 2, 5, 12, 30 days), you could group them into bands like "0-7 Days", "8-14 Days", and "15+ Days" to analyze your team's response times.
Let's watch a video that focuses specifically on grouping numeric values.
Grouping Values with Pivot Tables: Learn Excel in 5 Minutes
This video from Maven Analytics gives a great walkthrough of grouping numeric data. It demonstrates how to take a long list of house prices and group them into logical price brackets to understand the market distribution.
Watch from 2:50 to 4:56. Observe the key steps: Right-clicking the numeric field in the Rows area and selecting 'Group'. Defining the 'Starting at', 'Ending at', and 'By' (the increment or band size) values. Adding a Count to the values area to see how many items fall into each group, which is a classic frequency distribution.
To reinforce this, the first video we watched also contains a short, excellent example of grouping numeric data.
3 PivotTable Grouping Tricks to Summarize Data FAST!
For another quick example, let's revisit the video from MyOnlineTrainingHub. It shows how to group employee ages into bands.
Watch from 4:13 to 5:24. This reinforces the process of grouping a numeric field ('Age') and even shows how to quickly visualize the result.
Your Turn: Practice Grouping
It's time to apply what you've learned. Please use the sample-data-for-pivot-table.xlsx file from our previous lessons. If you don't have it open, you can create a new PivotTable from that data.
Task 1: Quarterly Sales Report
- Create a PivotTable with
Salesin the Values area (as a Sum). - Put the
OrderDatefield in the Rows area. - Group the
OrderDateby both Quarters and Years. - Move the new
Yearsfield from the Rows area to the Columns area. - Your final report should show quarters listed down the side, years across the top, and the total sales for each period.
Task 2: Sales Distribution Analysis
- Create a new PivotTable.
- Drag the
Salesfield into the Rows area. - Right-click the sales values and Group them. Set the grouping to start at
0, end at50000, and go By10000. - Drag the
Salesfield again, this time into the Values area. - Change the calculation in the Values area to Count.
- Your result should be a table showing how many sales transactions occurred within each $10,000 price band.
Completing these tasks will solidify your ability to transform raw data into structured, analytical summaries.
Conclusion
Great work today! You've learned a pivotal skill for any MIS role. Grouping is what turns a long, unreadable list of data into a high-level summary that reveals trends and patterns.
Key Takeaways:
- Grouping transforms granular data (individual dates, unique numbers) into meaningful categories for analysis.
- You can group dates by Years, Quarters, Months, and Weeks. For weeks, you must group by 'Days' and set the number to 7.
- You can group numbers into bands (or "bins") by defining a start, end, and increment size. This is perfect for frequency distributions or creating categories like age groups or price brackets.
- The general process is the same for both: add the field to the Rows area, right-click, and select Group.
In our next lesson, we'll build upon this by making our reports interactive. You'll learn how to add Slicers and Timelines. Timelines, in particular, are a visual filtering tool designed specifically to work with the date groups you learned to create today, allowing anyone to easily filter a report to a specific time period.