Hello! Welcome back to our study of Engineering Economics.
In the last few lessons, we’ve built up a powerful toolkit for Rate of Return analysis. We started by calculating a project's Internal Rate of Return (IRR), then used it to compare against a MARR, and finally developed a robust incremental analysis procedure to choose between multiple mutually exclusive alternatives.
Throughout this module, we've hinted that Present Worth (PW) analysis, which we mastered earlier, is often considered the more reliable method. You've seen that simply picking the project with the highest IRR can be misleading. Today, we will connect all the dots. Our goal is to explain the relationship between the Present Worth and Rate of Return analysis methods. By the end of this lesson, you will understand not just how they relate, but why PW is the gold standard for ranking projects and how to use IRR analysis correctly to arrive at the same, value-maximizing conclusion.
The Fundamental Link: Where PW and IRR Meet
At the most basic level, Present Worth and Internal Rate of Return are two sides of the same coin. Let's start with their mathematical definition.
Recall that the Present Worth (PW) of a project is calculated by discounting all future cash flows back to time zero using a specific interest rate i, which is typically your MARR:
Where is the net cash flow at time .
The Internal Rate of Return (IRR), on the other hand, is defined as the specific interest rate, let's call it , that makes the Present Worth of the project exactly zero.
This relationship is best understood visually.
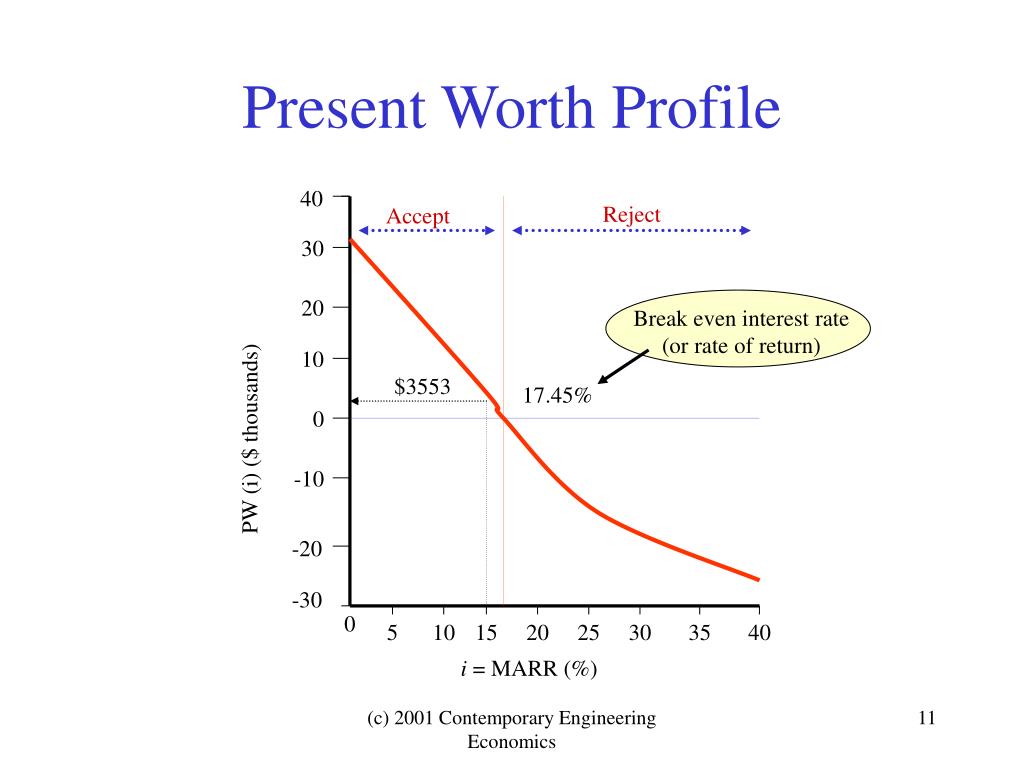
This graph reveals the core connection between the two methods for a single project's accept/reject decision:
- If your MARR is less than the IRR, you are operating on the left side of the break-even point. As the graph shows, the PW will be positive. The project is acceptable.
- If your MARR is greater than the IRR, you are on the right side of the break-even point. The PW will be negative. The project is not acceptable.
For deciding whether a single, independent project is viable, PW and IRR will always lead you to the same conclusion.
The Conflict: Why Ranking by IRR Can Be Misleading
The harmony between PW and IRR breaks down when we need to choose between mutually exclusive alternatives. This is where you, as a manager deciding between different technology platforms or project scales, must be most careful.
The problem is that IRR is a relative measure (a percentage), while PW is an absolute measure (a dollar value). A project can have a very high percentage return on a small investment, while another has a slightly lower, but still excellent, return on a much larger investment. Your goal is to maximize wealth, not just the rate of return.
Let's look at an example to make this concrete.
Vol. II, Essay 4: Financial Assessment
The following table from the MIT OCW essay 'Financial Assessment' clearly illustrates how ranking by IRR and PW can lead to different conclusions.
Please examine Table 1. Notice the four projects (A, B, C, D) and their respective Investment, Net Present Value, and IRR. Assume your company's MARR is 10%.
Here’s a summary of the key data for the acceptable projects (IRR > 10% MARR):
| Project | Investment | Net Present Value (NPV) | IRR |
|---|---|---|---|
| B | $2 million | $2.4 million | 22% |
| C | $3 million | $3.0 million | 20% |
| D | $4 million | $0.8 million | 12% |
If you were to rank these projects:
- By IRR: You would choose Project B (22% is the highest).
- By PW (or NPV): You would choose Project C ($3.0M is the highest).
This is a direct conflict. Choosing Project B means leaving potential value on the table. You would gain $2.4M in present value, but forgo the opportunity to gain $3.0M by choosing Project C. The reason is that Project C, while having a slightly lower rate of return, applies that return to a larger investment, ultimately creating more absolute value.
Reconciliation: How Incremental Analysis Aligns IRR with PW
So, how do we resolve this? How can we use the IRR method and still arrive at the correct choice, which is Project C? The answer lies in the incremental analysis we practiced in the last lesson.
Incremental analysis bridges the gap by forcing the IRR method to consider the return on the additional investment, thereby aligning it with the goal of maximizing total present worth.
Let's visualize the PW of two competing projects.
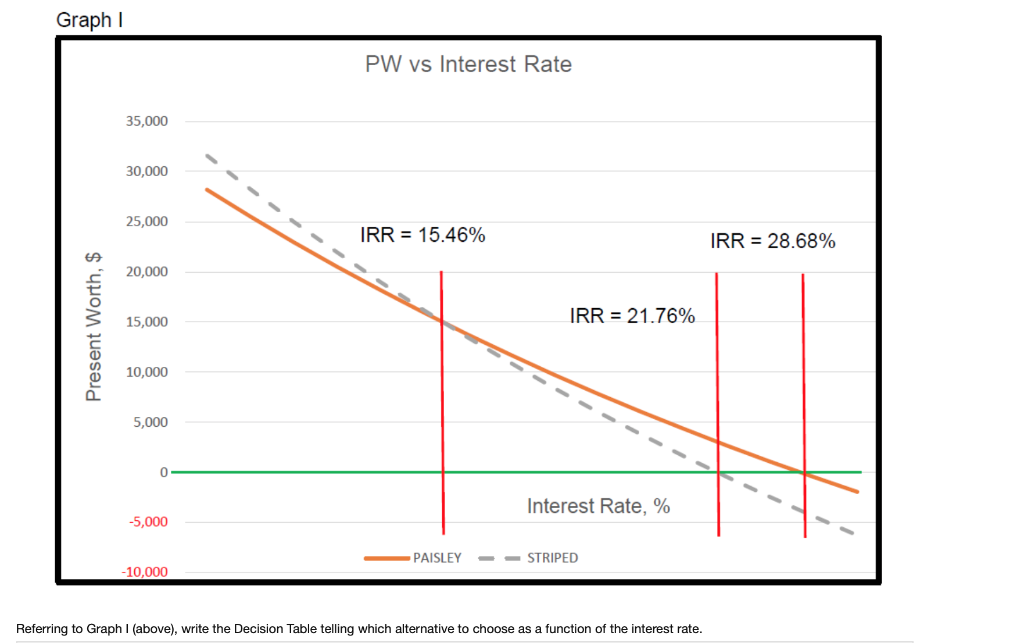
Here's how to interpret this powerful graph:
- Individual IRRs: Each project's IRR is where its curve crosses the PW = $0 axis. 'STRIPED' has a higher IRR (~29%) than 'PAISLEY' (~22%). A naive IRR ranking would favor 'STRIPED'.
- The Crossover Point: The two curves intersect at an interest rate of 15.46%. This specific rate is the incremental IRR (
IRR(PAISLEY - STRIPED)). At this rate, both projects have the same PW, meaningPW(PAISLEY) - PW(STRIPED) = 0. - The Decision Zone:
- If your MARR is less than the incremental IRR (e.g., 10%), you are in the region where the 'PAISLEY' curve is above the 'STRIPED' curve. This means
PW(PAISLEY) > PW(STRIPED), so you should choose PAISLEY, even though it has the lower IRR! - If your MARR is greater than the incremental IRR (e.g., 18%), the 'STRIPED' curve is higher, meaning
PW(STRIPED) > PW(PAISLEY). You should choose STRIPED.
- If your MARR is less than the incremental IRR (e.g., 10%), you are in the region where the 'PAISLEY' curve is above the 'STRIPED' curve. This means
This demonstrates the crucial insight: a proper incremental IRR analysis is mathematically equivalent to a PW analysis. The rule "if IRR(Incremental) > MARR, choose the higher investment" is the same as asking "if PW(Incremental) > 0, choose the higher investment," which is of course the same as choosing the project with the higher total PW.
Engineering Risk Benefit Analysis
This set of slides from an MIT course on Risk Benefit Analysis provides a final, concise summary of this relationship.
Please read slides 33 and 38, titled 'PW on Incremental Investment Revisited' and 'Summary'. These slides explicitly state the conclusion of our analysis today.
As the resource confirms:
- PW-based results using total and incremental investments are identical.
- The IRR criterion on differences (incremental cash flows) gives results consistent with the PW criterion.
- The IRR criterion on total investments may not give consistent results.
Test your understanding!
Your team is evaluating two mutually exclusive software development projects, Alpha and Beta.
- Project Alpha: Investment $100k, IRR 30%, PW at 12% MARR = $50k.
- Project Beta: Investment $500k, IRR 22%, PW at 12% MARR = $150k.
Which project should you choose and why, based on today's lesson?
Show answer
You should choose Project Beta.
While Project Alpha has a higher IRR (30% vs 22%), Project Beta has a much higher Present Worth ($150k vs $50k). Since the goal is to maximize the value generated for the company, choosing the project with the highest PW is the correct decision. The high IRR of Project Alpha is on a much smaller investment, leading to less overall wealth creation. A correct incremental IRR analysis would also lead to choosing Beta, as the return on the additional $400k investment would be greater than the 12% MARR.
Conclusion
You have now connected two of the most important evaluation techniques in engineering economics. Understanding this relationship elevates your ability from simply applying a formula to truly understanding the economic principles behind your decisions.
- Key Takeaways:
- PW and IRR are fundamentally linked: A project's IRR is the discount rate that makes its PW equal to zero.
- For accept/reject decisions on single projects, both methods agree.
- For ranking mutually exclusive projects, PW analysis is the direct and most reliable method because it measures absolute value creation.
- Simple IRR ranking can be misleading as it ignores the scale of investment.
- Incremental IRR analysis is the procedure that reconciles the IRR method with PW analysis, ensuring you select the project that truly maximizes value.
Preview of the Next Lesson
We have now concluded our deep dive into rate of return analysis. In the next module, we will introduce another widely used evaluation method: Benefit-Cost (B/C) Analysis. We will learn how to identify and quantify project benefits and costs to calculate a B/C ratio, a technique especially common in public projects but also valuable for framing decisions in the private sector.