Hello! Welcome back to our course.
In our last lesson, we constructed a complete after-tax model of a project, incorporating depreciation and taxes to get a realistic view of its financial viability. However, any such model is built on a foundation of estimates—about future sales, operating costs, development time, and more. What happens if those estimates are wrong?
This lesson addresses that crucial question. Our learning outcome is to incorporate sensitivity analysis to assess the impact of uncertainty on a project recommendation. Your experience building and managing projects from scratch means you're already familiar with the uncertainty inherent in forecasting. Sensitivity analysis provides a systematic, quantitative method to "stress-test" your financial projections and identify the biggest risks before committing significant resources.
We will cover:
- The definition and purpose of sensitivity analysis.
- How to perform a one-variable-at-a-time sensitivity analysis.
- How to structure the analysis in a spreadsheet.
- An introduction to the visual tools used to present the results, like Tornado diagrams.
1. Understanding Uncertainty and Sensitivity Analysis
All project evaluations deal with an unknown future. As the project lead, your job isn't to eliminate uncertainty, but to understand and manage its potential impact.
1.011 Project Evaluation Dealing with Risks & Uncertainty
To start, let's get a clear definition of uncertainty, risk, and how sensitivity analysis fits in. Please read the introductory sections from this MIT lecture note.
Please read the sections titled 'Definitions' and 'Sensitivity Analysis'. Focus on how it defines risk and what questions a sensitivity analysis aims to answer (e.g., 'What factors to vary? by how much?').
The key idea is that sensitivity analysis investigates how the output of your financial model (like Net Present Worth) changes in response to changes in your input assumptions. It helps you answer the question: "How much does my final decision depend on this specific estimate?"
In the context of software and technology projects, this analysis is a central part of due diligence.

Sensitivity vs. Scenario Analysis
It's important to distinguish sensitivity analysis from a related technique, scenario analysis.
- Sensitivity Analysis: Changes one variable at a time, keeping all others constant at their base-case values. This isolates the impact of a single factor.
- Scenario Analysis: Changes multiple variables simultaneously to model a particular future state (e.g., a "worst-case" scenario with low sales, high costs, and project delays).
We will focus on sensitivity analysis today and explore scenario analysis in a later lesson.
2. How to Perform a Sensitivity Analysis
The most common approach is a univariate (one-variable-at-a-time) sensitivity analysis. The process is straightforward and is best performed in a spreadsheet.
5.4 Evaluation of Risk – Engineering Economics
This guide provides a clear, step-by-step process for conducting a sensitivity analysis. It formalizes the intuition of testing your assumptions.
Read the section '5.4.1 Sensitivity Analysis'. Pay close attention to the five steps listed for performing a univariate analysis. These steps form our practical roadmap.
Let's summarize and apply those steps to a software project:
- Establish a Base Case: This is the full after-tax cash flow model you built in the last lesson, using your most likely estimates for all variables. Calculate the base-case NPW.
- Identify Key Variables: Select the uncertain variables you want to test. For a new SaaS product, these would likely be:
- Number of monthly subscribers (demand)
- Monthly subscription price
- Initial development cost
- Annual operating costs (servers, support, etc.)
- The discount rate (MARR) itself
- Define a Range: Determine a plausible range of variation for each variable. A common starting point is ±10%, ±20%, and ±30% from the base-case estimate.
- Recalculate NPW: For each variable, change its value across its defined range while holding all other variables at their base-case values. Record the resulting NPW for each change.
- Compile and Visualize: Gather the results into a table and create charts to visualize the impact.
The following video is an excellent demonstration of how to implement this process efficiently in a spreadsheet using data tables.
Sensitivity Analysis and Tornado Plots
This video provides a practical walkthrough of setting up a sensitivity analysis in a spreadsheet. Although the example is from chemical engineering, the NPV calculation and the spreadsheet mechanics are universal.
Please watch from 0:57 to 6:22. The first part (0:57-3:22) sets up the NPV problem and manually shows how changing an input affects the output. The second part (3:22-6:22) demonstrates the powerful 'Data Table' feature in Excel to automate this process. Focus on the how-to of this step.
Test your understanding!
You are evaluating a project to build a new internal DevOps platform. Your base-case analysis gives an NPW of $500,000. One of your key assumptions is the annual cost savings from improved developer productivity, estimated at $200,000 per year.
How would you set up a sensitivity analysis to test this single variable? What values would you calculate?
Show answer
- Variable: Annual cost savings.
- Range: You might choose a range like ±20%. This means you'd test values from $160,000 (-20%) to $240,000 (+20%).
- Calculation: You would recalculate the project's entire after-tax NPW at different levels of savings (e.g., $160k, $180k, $200k, $220k, $240k), keeping all other assumptions (initial cost, project life, MARR, etc.) exactly the same as the base case. The goal is to see how much the $500k NPW changes and, crucially, at what point it might turn negative.
3. Visualizing the Results: The Tornado Diagram
Once you have a table of results, you need a way to communicate the findings clearly. The most effective tool for this is a Tornado Diagram.
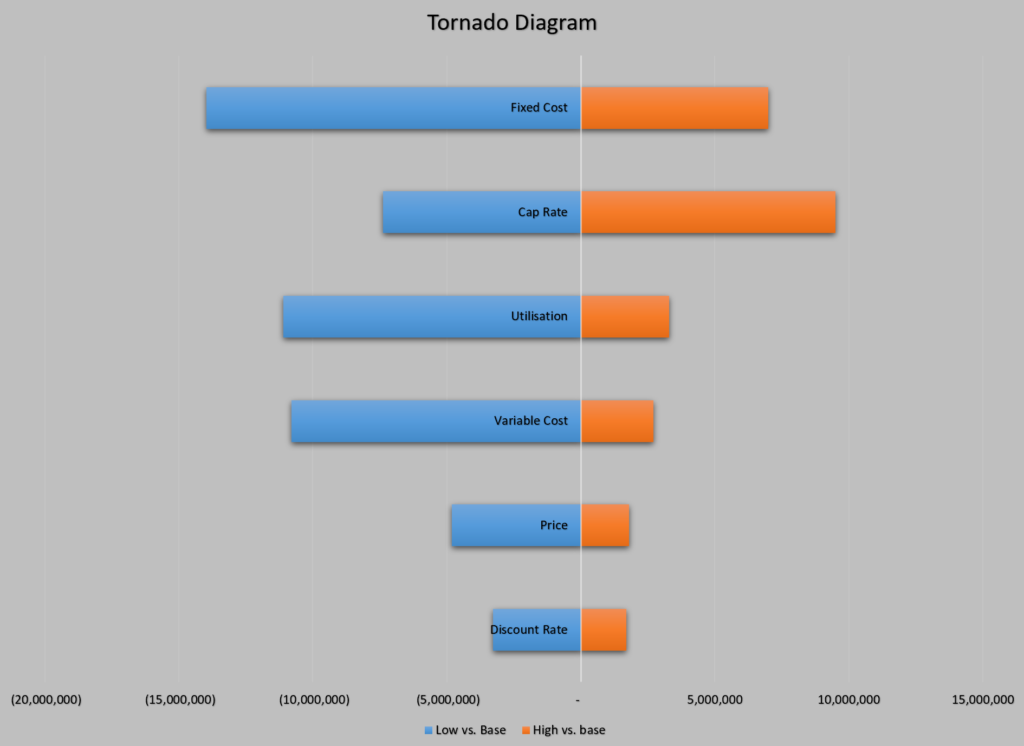
The power of this diagram is its immediacy. A manager can glance at it and instantly see which variables represent the most significant risks (the ones at the top). In the example above, "Fixed Cost" is the most critical uncertainty to manage.
The video you watched earlier continues to show exactly how to create such a plot from your data.
Sensitivity Analysis and Tornado Plots
Now, let's see how to turn the data table we just created into a professional-looking Tornado Plot. This is a skill you can directly apply in your project reports.
Please watch the remainder of the video (6:22 to 10:31). The first part shows the step-by-step process of creating the chart in a spreadsheet. The final part explains how to interpret the plot to inform decisions—this is the 'so what?' of our analysis.
The key takeaway is that by performing a sensitivity analysis and presenting it as a tornado diagram, you shift the conversation from "Is this a good project?" to "We believe this is a good project, and here are the three most important factors we need to get right for it to succeed." This is a far more strategic and managerially useful approach.
Conclusion
You've now learned how to move beyond a single-point estimate of a project's value and embrace uncertainty in a structured way. By incorporating sensitivity analysis, you can build much more credible and robust business cases for your technology initiatives.
- Key Takeaways:
- Sensitivity analysis is a method to quantify how changes in input assumptions affect a project's financial outcome (e.g., NPW).
- The standard approach is to vary one input at a time (univariate analysis) over a plausible range.
- Spreadsheet tools like 'Data Tables' can automate the recalculation of NPW for many different input values.
- A Tornado Diagram is the primary tool for visualizing the results, ranking variables by their impact on the project's outcome and immediately identifying the most critical risks.
Preview of the Next Lesson
While we've focused on how to perform the analysis and create the chart, the real value lies in its interpretation. In our next lesson, we will focus on how to interpret the results of a sensitivity analysis using a spider diagram to identify the most critical variables. We will compare the Tornado diagram with the Spider diagram and discuss how to use these visuals to strengthen your final project recommendation.