Hello! Welcome to our third lesson in the module on managing uncertainty in engineering projects.
In our previous session, we learned how to use breakeven analysis to find the specific value of a single variable (like sales volume) that makes a project financially viable. This gives us a clear target. But what about all the other estimates in our analysis? What if our forecast for development costs is off, or if the market demands a lower subscription price than we planned? And most importantly, which of these uncertainties poses the biggest risk to our project's success?
Today, we address that question by exploring sensitivity analysis. This lesson will describe the purpose of sensitivity analysis and how it helps us systematically identify the key variables that have the most significant impact on a project's financial outcome. This is a fundamental technique for managing risk in any technology venture.
1. Beyond Breakeven: What is Sensitivity Analysis?
While breakeven analysis focuses on one variable to find a single point, sensitivity analysis takes a broader view. It's a method for understanding how the uncertainty in our input estimates (like costs, revenues, or project life) translates into uncertainty in our results (like Net Present Worth or IRR).
To start, let's get a formal definition and understand the core process.
1.011 Project Evaluation Dealing with Risks & Uncertainty
This excerpt from an MIT lecture note on project evaluation provides a concise definition of sensitivity analysis and its place among other techniques for handling uncertainty.
Please read the sections titled 'Methods' and 'Sensitivity Analysis'. Focus on the definition provided and the 'Key choices' that need to be made when conducting the analysis.
As the notes explain, the process is quite systematic and can be thought of as a controlled experiment for your project model:
- Establish a Base Case: You begin by calculating your project's outcome (e.g., NPW) using your most likely or "best guess" estimates for every variable.
- Vary One Variable: You then select one input variable and change its value by a certain percentage (e.g., ±10%, ±20%) or over a plausible range, while keeping all other variables constant at their base case values.
- Observe the Impact: You record how much the outcome (NPW) changes in response to the change in the input variable.
- Repeat: You repeat this process for each of the key uncertain variables in your project.
The goal is to discover which variables cause the largest "swing" in your project's NPW. If a small change in an estimate causes a large change in the project's profitability, the project is said to be highly sensitive to that variable. These are your critical variables—the ones you need to watch closely.
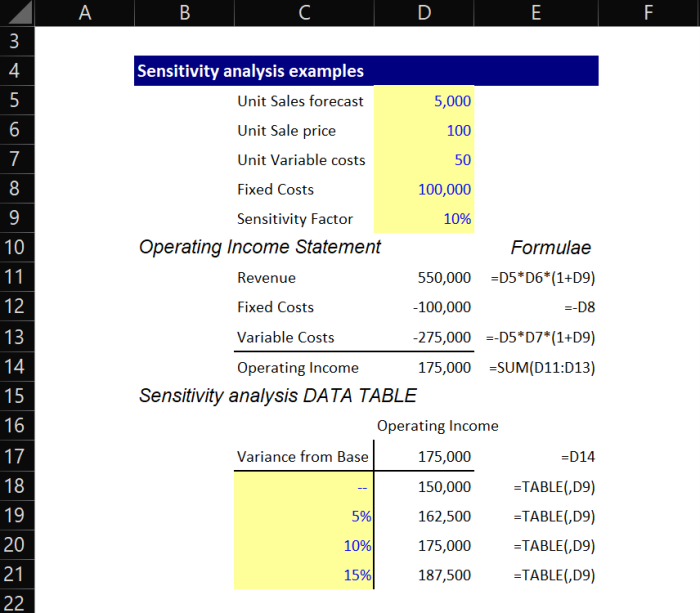
The image below shows a simple example of how this might look in a spreadsheet. A data table is used to calculate how "Operating Income" changes as a key input is varied from its base case.
2. The Purpose: Prioritizing Uncertainty with the "Value of Information"
So, why do we do this? Identifying sensitive variables isn't just an academic exercise. It's a powerful strategic tool that tells you where to focus your limited time, energy, and resources. This idea is central to the field of software engineering economics.
Software Engineering Economics
This classic paper on Software Engineering Economics by Barry Boehm discusses decision-making under uncertainty and the concept of 'buying information' to reduce risk. This provides the strategic 'why' behind sensitivity analysis.
Please read the section 'Analyzing Risk, Uncertainty, and the Value of Information.' Pay close attention to the five 'Conditions' that justify investing in more information.
Boehm's paper argues that it's often worth paying to reduce uncertainty—through actions like prototyping, user surveys, or feasibility studies—before committing to a full-scale project. Sensitivity analysis is the tool that tells you which uncertainties are worth paying to reduce.
Here's how it connects:
- Sensitivity analysis directly identifies variables where the "payoff varies greatly" (Boehm's Condition 1). If your project's NPW is extremely sensitive to the number of active users, that's a critical variable.
- If you are also highly uncertain about that variable—for example, your market research is weak (violating Boehm's Condition 3)—then you have identified a major project risk.
The purpose of sensitivity analysis, therefore, is to flag these high-impact, high-uncertainty variables. This allows you, as a manager, to make informed decisions: "Our project's success is highly sensitive to the user conversion rate. Our estimate for this is just a guess. Therefore, it's worth investing in a targeted ad campaign and a landing page prototype to get real data before we build the entire platform."
Test your understanding!
You are managing the development of a new Django-based e-commerce platform. Your initial analysis shows the project has a positive NPW. You are uncertain about three key estimates:
- The initial development cost.
- The monthly server hosting and maintenance costs.
- The average transaction fee you can charge customers.
You run a sensitivity analysis. The results show that a 20% error in the transaction fee estimate has a much larger impact on the project's NPW than a 20% error in either of the cost estimates. What is the primary strategic takeaway?
Show answer
The primary takeaway is that the project's viability is most sensitive to the average transaction fee. This variable represents the highest risk and uncertainty. Therefore, you should prioritize efforts to validate this estimate. This could involve conducting competitor analysis, surveying potential customers about pricing, or running A/B tests on a prototype to see what fee the market will bear. The cost estimates, while important, are less critical to get exactly right at this stage.
3. A Software Example: The COCOMO Model
This concept is so fundamental that it's built into sophisticated project estimation models. The COCOMO (Constructive Cost Model) is a famous algorithm for estimating software development effort, and it explicitly supports sensitivity analysis.
Software Engineering Economics
In the same paper, Boehm introduces his COCOMO model. A brief section demonstrates exactly how the model can be used for sensitivity analysis.
Find the paragraph that begins 'As mentioned above, COCOMO also supports the most common types of sensitivity analysis...' and read to the end of that section. Notice how changing a single project attribute affects the final effort estimate.
The example given is a perfect illustration of the purpose of sensitivity analysis. By changing a single input parameter—TURN (computer turnaround time)—from "nominal" to "low" (e.g., by giving developers faster, interactive tools), the model shows a reduction in the estimated project effort from 59 man-months to 51 man-months.
This allows a manager to answer a critical investment question: "Is the cost of providing interactive terminals for my development team justified by the 8 man-month reduction in project effort?" Sensitivity analysis provides the quantitative data needed to make that trade-off decision. You could run the same analysis on other COCOMO variables like TOOL (use of software tools) or PCAP (programmer capability) to see which investments in your team or environment would yield the biggest returns in productivity.
Conclusion
Today we've moved from the single-point focus of breakeven to the more comprehensive view of sensitivity analysis. You now understand its critical role in navigating the uncertainties inherent in technology projects.
- Key Takeaways:
- Sensitivity analysis is a systematic technique for identifying which project variables have the most significant impact on its financial success.
- It works by establishing a base case and then changing one variable at a time to observe the effect on an outcome like NPW.
- Its primary purpose is strategic: to identify the most critical uncertainties so you can focus your resources on "buying information" and mitigating the biggest risks.
Preview of the Next Lesson
We've established the what and the why of sensitivity analysis. In our next lesson, we will dive into the how. We will take a sample project and perform a one-variable sensitivity analysis on its Present Worth, and learn how to present the results visually using a spider diagram.