Hello! Welcome back to our work on probabilistic analysis.
In the last lesson, we focused on the creative process of constructing a decision tree from a problem description. You learned how to map out a sequence of choices and uncertainties, turning a complex scenario into a logical, visual diagram.
Today, we'll shift from construction to formal identification. Our goal is to identify decision nodes, chance nodes, and payoffs within a decision tree. This might sound like a review, but our aim is to solidify the precise role and meaning of each component. A deep understanding of the "anatomy" of a decision tree is essential before we can learn how to "solve" it, which will be our focus in the next lesson.
1. Formalizing the Components: Nodes and Branches
A decision tree is a model of a sequential decision problem. As we saw last time, it's composed of nodes (the shapes) and branches (the lines connecting them). There are three fundamental types of nodes, each with a distinct purpose and symbol.
To get a clear, formal definition of these components, let's turn to a chapter from a textbook on the topic.
Introduction to Decision Trees
The document 'Introduction to Decision Trees' provides excellent, concise definitions for the building blocks of a decision tree. It clearly distinguishes between controllable and uncontrollable factors.
Please read the subsection titled 'Nodes and Branches'. It starts right after the 'DriveTek Problem' description. Focus on the definitions of decision node, event node (also called a chance node), and terminal node. Pay attention to the table in Figure 14.1 that summarizes the symbols.
Let's break down the key ideas from that reading:
Decision Nodes: Points of Control
- Symbol: A square (☐).
- Represents: A point in time where you, the decision-maker, must make a choice.
- Branches: The lines extending from a decision node represent the alternatives or courses of action available (e.g., "Build new feature," "Buy third-party library," "Do nothing").
- Key Idea: These are the controllable parts of your problem. You have direct authority over which branch is chosen.
Chance Nodes: Points of Uncertainty
- Symbol: A circle (◯).
- Represents: A point where an uncertain event occurs, the outcome of which is outside your control. These are often called "states of nature."
- Branches: The lines extending from a chance node represent the possible outcomes of the uncertain event (e.g., "Market response is strong," "Market response is weak").
- Key Idea: These are the uncontrollable parts of your problem. Each branch must have a probability assigned to it, and the probabilities for all branches from a single chance node must sum to 1.0.
For a quick visual recap of these standard symbols, the following short video clip is very helpful.
How to Create a Decision Tree | Decision Making Process Analysis
This clip from Wondershare Edraw's 'How to Create a Decision Tree' gives a rapid, clear visual summary of the symbols for each node.
Please watch the segment from 01:21 to 01:57. It provides a simple and direct explanation of the symbols for decision nodes, chance nodes, and end nodes.
2. Terminal Nodes and Payoffs: Measuring the Outcome
Every path through a decision tree, from the root on the left to the final branch on the right, represents a unique scenario. The end of each path is a terminal node (often shown as a triangle, △, or just the end of the line), and it has a crucial piece of information: the payoff.
A payoff is the net value of a scenario. It represents the total profit, cost, or other value measure resulting from the specific sequence of decisions and events along that path.
In your work, this is equivalent to calculating the final financial outcome of a project plan. For example, if you decide to build a platform (a cost), the market responds favorably (a revenue), and then you decide to scale up (another cost), the payoff is the sum of those cash flows.
The DriveTek example from our earlier reading provides an excellent illustration of how payoffs are calculated.
Introduction to Decision Trees
Let's return to the 'Introduction to Decision Trees' document to see how payoffs are calculated and placed on the tree. This section moves from structure to quantification.
Please read the section '14.2 DECISION TREE TERMINAL VALUES'. Focus on the definition of a terminal value (payoff). Carefully examine Figure 14.4 and the accompanying text. See how cash flows are assigned to the branches. Pay close attention to Figure 14.5, which shows exactly how one of the terminal values ($30,000) is calculated by summing the cash flows along its path. This is a critical concept.
The key takeaway is that the payoff isn't just one number; it's the cumulative result of an entire journey through the tree.
Test your understanding!
Let's analyze the components of the following decision tree diagram.
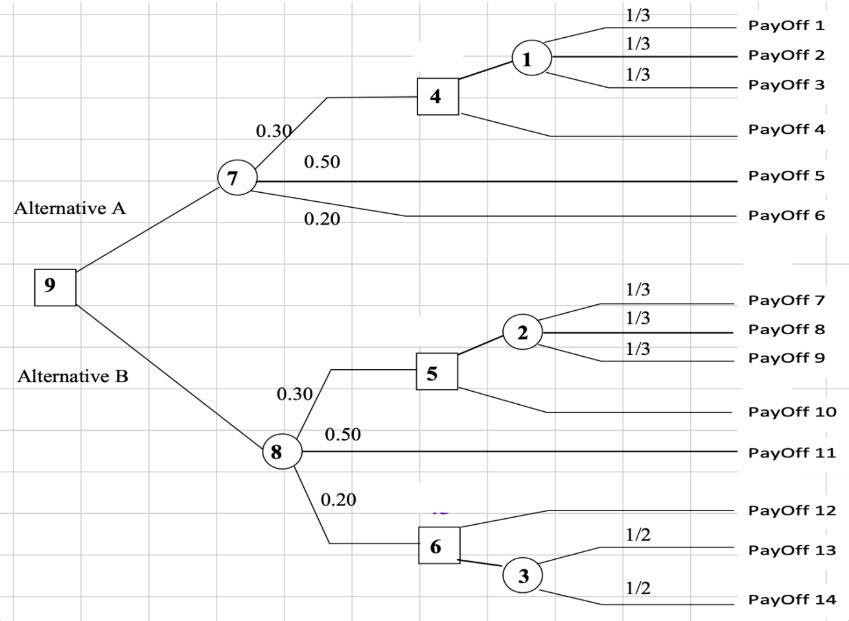
Based on the diagram and the definitions we've just covered:
- How many decision nodes are there in this tree?
- How many chance nodes are there?
- What is the significance of the numbers (0.30, 0.50, 0.20) on the branches leaving chance node #7?
- What does the value "PayOff 4" represent?
Show answer
- There are four decision nodes (squares), labeled 9, 4, 5, and 6.
- There are four chance nodes (circles), labeled 7, 8, 1, and 2. (Node 3 is shown but has no branches, so it's not a functional chance node in this diagram).
- These numbers are the probabilities of the different states of nature occurring after choosing "Alternative A". There is a 30% chance of the top path, a 50% chance of the middle path, and a 20% chance of the bottom path occurring. Note that they sum to 1.0 (0.30 + 0.50 + 0.20 = 1.0).
- "PayOff 4" is the terminal value or net payoff for one specific scenario. That scenario is: choosing "Alternative A" at decision node 9, then having the middle outcome (with 50% probability) occur at chance node 7, and finally choosing the bottom path at decision node 5.
Conclusion
In this lesson, we formalized our understanding of the essential components of a decision tree. By precisely defining each element, we are now better equipped to not just build, but also interpret and analyze these powerful models.
- Key Takeaways:
- Decision Nodes (☐): Represent points of control where you choose an alternative.
- Chance Nodes (◯): Represent points of uncertainty where an outcome occurs according to probabilities.
- Payoffs: The terminal values at the end of each path, representing the net outcome of a specific sequence of decisions and events. They are calculated by summing the cash flows along a path.
Preview of the Next Lesson
Now that we have a solid grasp of a decision tree's structure and components, we are ready to use it to find the best strategy. In our next lesson, we will learn how to analyze a decision tree by applying the rollback procedure. This technique allows us to work backward from the payoffs, calculating expected values at each node to reveal the optimal choice at the very beginning of the problem.