Hello! In our last lesson, we established the foundation of the Aggregate Demand (AD) framework in a two-sector economy, where AD is the sum of Consumption (C) and Investment (I). We noted that consumption is influenced by the level of income (Y). Today, we will explore this relationship in detail by learning how to measure and calculate the behavioral tendency of households to consume or save out of their income.
This lesson is crucial for building your confidence with numericals. We will define and calculate the four key 'propensities' that form the bedrock of the entire Income and Employment unit:
- Average Propensity to Consume (APC)
- Average Propensity to Save (APS)
- Marginal Propensity to Consume (MPC)
- Marginal Propensity to Save (MPS)
By the end of this lesson, you will be able to define each of these concepts, understand their formulas, and calculate them from given data—a skill that is directly tested in your board exams.
1. The 'Average' Propensities: APC and APS
First, let's look at how we can describe the proportion of total income that is used for consumption or saving. This is measured by the Average Propensities.
- Average Propensity to Consume (APC): The ratio of total consumption to total income. It answers the question: "On average, what fraction of our income are we spending?"
- Average Propensity to Save (APS): The ratio of total saving to total income. It answers the question: "On average, what fraction of our income are we saving?"
A clear understanding of the definitions, formulas, and possible values of APC and APS is essential. Let's watch a video that explains these concepts thoroughly.
APC APS MPC MPS | Meaning Diagram Minimum & Maximum values | AD- AS Part 6 Class 12 Macro economics.
The video "APC APS MPC MPS" by Sunil Panda offers a detailed and clear explanation of these fundamental concepts, which is perfect for rebuilding your theoretical foundation.
Please watch the following segments carefully: What is APC? This part defines APC and introduces its formula. Values of APC: This segment is very important. It explains why APC can be greater than 1, equal to 1, or less than 1. Pay attention to the logic: when consumption is more than income (due to borrowing or using past savings), APC > 1. What is APS? This section defines APS and its formula. Values of APS: Watch this part to understand why APS can be negative (when savings are negative, i.e., dissaving), zero, or positive, but can never be 1 or more.
The Relationship between APC and APS
Since your income (Y) can only be either consumed (C) or saved (S), it follows that Y = C + S. This simple identity leads to a crucial relationship between APC and APS. If we divide the entire equation by Y:
This means that the fraction of income consumed and the fraction of income saved must add up to 1. This relationship is very useful for solving numerical problems. If you know APC, you can easily find APS, and vice-versa.
Let's see the derivation and a few examples in the same video.
APC APS MPC MPS | Meaning Diagram Minimum & Maximum values | AD- AS Part 6 Class 12 Macro economics.
Continuing with the same video by Sunil Panda.
Watch the segment from this part, which proves the relationship APC + APS = 1 and shows how to use it in calculations.
2. The 'Marginal' Propensities: MPC and MPS
While average propensities look at total income, Marginal Propensities focus on the effect of additional or extra income. This is a vital concept for understanding economic behavior and is represented by the Greek letter delta (), which signifies 'change'.
- Marginal Propensity to Consume (MPC): The ratio of the change in consumption to the change in income. It answers the question: "If we get one more rupee of income, how many paise of that rupee will we spend?"
- Marginal Propensity to Save (MPS): The ratio of the change in saving to the change in income. It answers the question: "If we get one more rupee of income, how many paise of that rupee will we save?"
Let's turn back to our video resource for a clear explanation of MPC and MPS.
APC APS MPC MPS | Meaning Diagram Minimum & Maximum values | AD- AS Part 6 Class 12 Macro economics.
This video by Sunil Panda will now explain the 'marginal' concepts.
Please watch these segments: What is MPC? This part distinguishes between APC and MPC and gives the formula for MPC. The distinction between "income" and "additional income" is key. Values of MPC: This segment explains the crucial rule that MPC always lies between 0 and 1. What is MPS? Watch this part for the definition and formula of MPS.
The Relationship between MPC and MPS
Just like with average propensities, any change in income () must be split between a change in consumption () and a change in saving (). Therefore, ΔY = ΔC + ΔS.
Dividing this equation by ΔY gives us another fundamental identity:
This means that the fraction of any additional income consumed and the fraction saved must always sum to 1. This is another essential shortcut for your numericals.
The final segment from this video explains this relationship.
APC APS MPC MPS | Meaning Diagram Minimum & Maximum values | AD- AS Part 6 Class 12 Macro economics.
One last time with this video from Sunil Panda.
Watch the derivation and explanation from this clip.
3. Calculation and Practice
Now that we have the theory and formulas, let's focus on applying them—the part you want to master. The most common format for these questions in your exam is a table with missing values.
Let's watch a quick, fast-paced video that demonstrates exactly how to fill in these tables.
AD AS MOST IMPORTANT NUMERICALS ALL TYPES 🔴LIVE. 12 MARKS FIXED IN CLASS 12 EONOMICS BOARD EXAM 2026
This video, "AD AS MOST IMPORTANT NUMERICALS," also by Sunil Panda, is very exam-oriented and gets straight to the calculations.
Watch how a 'fill-in-the-blanks' table is solved: Calculating APC and APS: Notice the quick use of the APS = 1 - APC formula. Calculating MPC and MPS: See how the 'change' columns are calculated first (e.g., Change in Y = Y₂ - Y₁), which is the most important step for finding MPC and MPS.
Guided Practice
Let's try a comprehensive problem. The image below shows a solved table from the Teachoo resource, which is a perfect template for how to approach these questions.
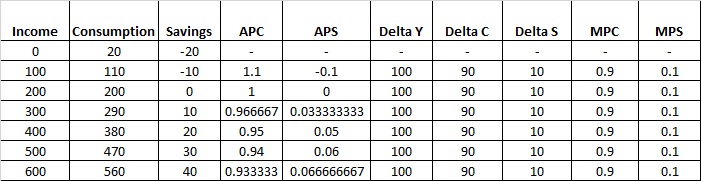
Now, let's apply this method to a typical exam-style question.
Problem: Complete the following table.
| Income (Y) | Consumption (C) | MPC | APS |
|---|---|---|---|
| 0 | 20 | - | - |
| 100 | 110 | ? | ? |
| 200 | 200 | ? | ? |
Solution Walkthrough:
- Find Missing Values (like Savings): We need Savings (S) to calculate APS. Remember
S = Y - C.- Row 1: S = 0 - 20 = -20
- Row 2: S = 100 - 110 = -10
- Row 3: S = 200 - 200 = 0
- Calculate Changes (ΔY, ΔC): We need these for MPC.
- For Row 2: ΔY = 100 - 0 = 100; ΔC = 110 - 20 = 90
- For Row 3: ΔY = 200 - 100 = 100; ΔC = 200 - 110 = 90
- Calculate MPC:
MPC = ΔC / ΔY- Row 2: MPC = 90 / 100 = 0.9
- Row 3: MPC = 90 / 100 = 0.9
- Calculate APS:
APS = S / Y- Row 1: APS = -20 / 0 = Undefined
- Row 2: APS = -10 / 100 = -0.1
- Row 3: APS = 0 / 200 = 0
Completed Table:
| Income (Y) | Consumption (C) | MPC | APS |
|---|---|---|---|
| 0 | 20 | - | Undefined |
| 100 | 110 | 0.9 | -0.1 |
| 200 | 200 | 0.9 | 0.0 |
Your Turn: Practice Problem
Now it's your turn to practice. This is the best way to prepare for the exam. Use the methods we've just discussed to solve the following problem.

Problem (Question 1 from the image):
From the following schedule, compute APC, APS, MPC, and MPS.
| Income (₹) | 50 | 100 | 150 | 200 |
|---|---|---|---|---|
| Saving (₹) | 10 | 40 | 75 | 120 |
Take a few minutes to create a full table with columns for Y, S, C, ΔY, ΔS, ΔC, APC, APS, MPC, and MPS. Calculate all the values.
...
Solution:
You can find the detailed, step-by-step solution in the resource below. Compare your answer with it.
[Macroecomics] Practical Questions - MPC and MPS - Teachoo
This webpage from Teachoo contains solved examples for practice.
Scroll down to Example 11 to see the fully worked-out solution for the problem you just attempted. Check if your table and calculations match.
Conclusion
Excellent work today. We have thoroughly covered the definitions and calculation methods for APC, APS, MPC, and MPS. Mastering these four concepts and their interrelationships is non-negotiable for scoring well in the Macroeconomics numerical section.
Key Takeaways:
- Average Propensities relate total consumption/saving to total income.
- Key Identity:
- Marginal Propensities relate the change in consumption/saving to the change in income.
- Key Identity:
- The first step in table-based problems is always to calculate the "change" columns (, , ).
In our next lesson, we will use these concepts to build the complete algebraic equations for the Consumption Function (C = C̄ + bY) and the Saving Function (S = -C̄ + (1-b)Y). You will see that the MPC you learned to calculate today is the 'b' in the consumption function, a crucial parameter for determining equilibrium income.