Introduction
Hello! Welcome to a new module. In the previous lessons, we explored tree-based models, culminating in Random Forests, which make predictions by having many trees "vote" on the outcome. We're now shifting gears to an entirely different family of models: linear classifiers.
In this lesson, we'll start with one of the most fundamental and widely-used classification algorithms: Logistic Regression. Despite its name, it's a classification model, not a regression one. Your goal for this lesson is to understand its core mechanism: how it takes the output of a linear equation and cleverly uses a special function—the sigmoid function—to produce a probability. This simple but powerful idea is a cornerstone of many modern machine learning models, including neural networks.
From Linear to Logistic: The Need for Probabilities
You've already encountered linear regression in your studies, which models a relationship like to predict a continuous value. A natural first thought for a binary classification problem (e.g., predicting if a customer will buy insurance: yes/no, 1/0) might be to try and fit a straight line to the data.
However, this approach has two major flaws:
- Unbounded Output: A linear model's output can be any number, from to . This doesn't make sense for classification, where we want a probability between 0 and 1. How would you interpret a prediction of 1.5 or -0.2?
- Sensitivity to Outliers: The line of best fit can be heavily skewed by new data points, especially outliers. This can cause the decision threshold (e.g., classifying anything above 0.5 as "1") to shift, leading to incorrect classifications for existing points.
Let's watch a couple of short video clips that illustrate these problems perfectly.
Logistic Regression (and why it's different from Linear Regression)
First, this clip from Visually Explained quickly shows why a linear model's unbounded output is an issue for classification.
Watch from 02:06 to 02:37. Notice how the linear line extends beyond the logical 0 and 1 boundaries.
Machine Learning Tutorial Python - 8: Logistic Regression (Binary Classification)
Next, this video from codebasics provides a great practical example showing how outliers can drastically alter a linear regression line, making it unsuitable for a classification task.
Watch from 02:58 to 05:29. Pay attention to how adding a single, distant data point completely changes the best-fit line and messes up the classification boundary.
The Solution: The Sigmoid Function
To solve this, we need a way to take the unbounded output of the linear equation () and "squash" it into a valid probability range of [0, 1]. This is exactly what the sigmoid function does.
The sigmoid function, sometimes called the logistic function, is defined as:
It produces a characteristic "S-shaped" curve.
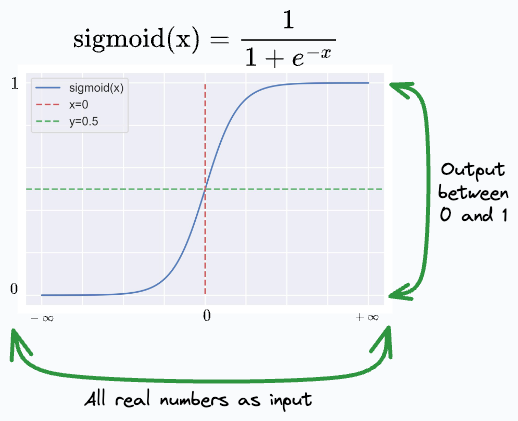
No matter how large or small the input is, the output will always be between 0 and 1.
- As approaches , approaches 0, so approaches .
- As approaches , approaches , so approaches 0.
- When , .
This elegant mathematical trick allows us to interpret the output directly as a probability. For example, if our model outputs 0.93, we can say there is a 93% probability that the sample belongs to the positive class (class 1).
The following reading from Google's Machine Learning Crash Course provides an excellent and concise explanation of this core concept.
Calculating a probability with the sigmoid function
Please read this short article. It clearly explains what the sigmoid function is and how it's used in logistic regression to calculate probabilities.
Read the sections titled 'Sigmoid function' and 'Transforming linear output using the sigmoid function'. Focus on the formula, the graph, and the explanation of how the linear output 'z' becomes the input to the sigmoid function.
Check Your Understanding
Let's quickly test this idea. Based on the article you just read, consider a logistic regression model with the following weights:
- Bias:
- Weight 1:
- Weight 2:
- Weight 3:
And an input example with these feature values:
- Feature 1:
- Feature 2:
- Feature 3:
1. First, calculate the linear output, :
Click to reveal the answer
2. Now, plug this value of into the sigmoid function to get the final probability:
(You can use a calculator. )
Click to reveal the answer
So, the model predicts a 73.1% probability that this example belongs to class 1.
This two-step process—calculating a linear score and then passing it through the sigmoid function—is the heart of logistic regression.
Conclusion
In this lesson, we bridged the gap between linear models and classification by introducing the sigmoid function. You saw why linear regression is a poor choice for classification tasks and how logistic regression elegantly solves the problem.
Key Takeaways:
- Logistic regression, despite its name, is a classification algorithm.
- It cannot use a linear model's output directly because the output is unbounded and not a valid probability.
- The core of logistic regression is the sigmoid function, , which squashes any real number into the range (0, 1).
- The final output is interpreted as the probability of the sample belonging to the positive class (e.g., class "1").
Preview of the Next Lesson
We now understand what a logistic regression model predicts and how it formulates that prediction as a probability. But how does the model learn the best values for its weights () and bias ()? In the next lesson, we will explore the loss function used to train logistic regression, which is known as cross-entropy loss. This will give us the complete picture of how the model is trained from data.