Introduction
Welcome back! In our last lesson, we focused on classifying price elasticity of demand and understanding its determinants using the SPLAT framework. You now have the tools to determine whether demand for a product is elastic, inelastic, or unit elastic.
Today, we will address a crucial, practical application of this concept, directly targeting our learning outcome: to relate price elasticity of demand to the effect of a price change on total revenue. For any business, pricing decisions are paramount. Should they raise the price to increase revenue, or lower it to attract more customers? The answer, as you'll see, depends entirely on the price elasticity of demand. This lesson provides a direct link between economic theory and real-world business strategy, a concept frequently tested in the CFA exam.
1. The Total Revenue Test
Total revenue (TR) is the total amount of money a firm receives from selling its goods or services. The formula is simple:
When a firm changes the price of its product, there are two opposing effects on total revenue:
- The Price Effect: A change in price directly affects the revenue earned per unit.
- The Quantity Effect: A change in price affects the number of units sold (due to the law of demand).
The Total Revenue Test is a method used to determine price elasticity by observing how total revenue changes when the price changes. The net impact on total revenue depends on which of the two effects—price or quantity—is stronger. Elasticity tells us exactly that.
The following video provides an excellent visual introduction to the Total Revenue Test.
Elasticity of Demand- Micro Topic 2.3
This clip from Jacob Clifford's channel uses simple graphs to demonstrate how a price increase affects the total revenue 'box' (P x Q) differently for inelastic and elastic goods.
Watch the segment from 03:41 to 05:17. Focus on understanding why the total revenue box gets bigger for an inelastic good (like gasoline) but smaller for an elastic good when the price rises.
As the video explains, the relationship is systematic. We can summarize the rules as follows:
| If Demand Is... | And Price... | Then Total Revenue... | Relationship |
|---|---|---|---|
| Elastic ($ | E_d | > 1$) | Increases ↑ |
| Elastic ($ | E_d | > 1$) | Decreases ↓ |
| Inelastic ($ | E_d | < 1$) | Increases ↑ |
| Inelastic ($ | E_d | < 1$) | Decreases ↓ |
Why does this happen?
- When demand is elastic, consumers are very sensitive to price changes. A price increase causes such a large drop in quantity sold that it outweighs the higher price per unit, causing total revenue to fall. The quantity effect dominates the price effect.
- When demand is inelastic, consumers are not very sensitive to price changes. A price increase causes only a small drop in quantity sold, so the higher price per unit more than makes up for the lost sales, causing total revenue to rise. The price effect dominates the quantity effect.
2. Elasticity, Total Revenue, and the Demand Curve
In our first lesson on elasticity, you learned that elasticity is not constant along a straight-line demand curve. This has a direct and predictable impact on total revenue. The relationship is best understood visually.
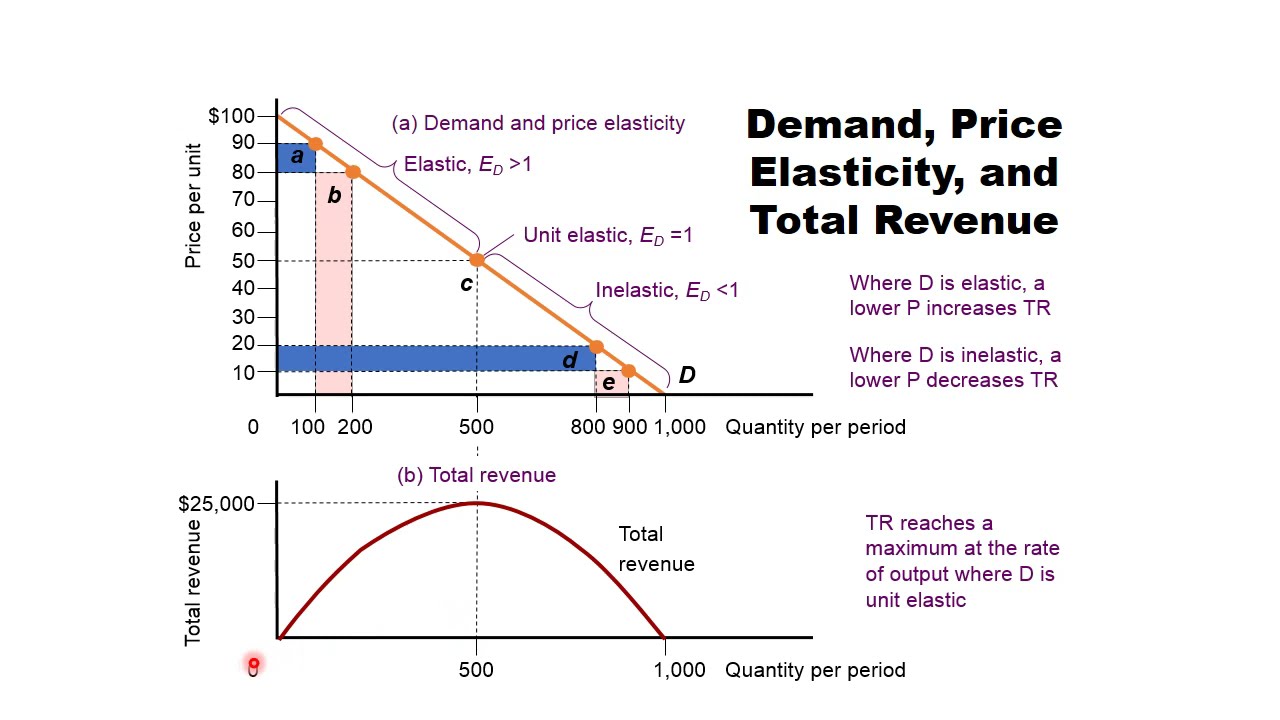
Let's break down what this powerful image shows:
- Elastic Region (upper left of the demand curve): Here, . As the graph shows, lowering the price in this region leads to an increase in total revenue.
- Inelastic Region (lower right of the demand curve): Here, . Lowering the price further moves the firm into this region, where doing so leads to a decrease in total revenue.
- Unit Elastic Point (the midpoint): At this exact point, . Total revenue is maximized. Any change in price from this point—whether an increase or a decrease—will cause total revenue to fall.
This concept is a cornerstone of microeconomics and vital for your exam. The following video walks through this relationship with a numerical example, which will help solidify your understanding.
CFA® Level I Economics - Own price Elasticity of Demand
This video from PrepNuggets explains how elasticity varies at different points on the demand curve and explicitly links this to total revenue, highlighting the revenue-maximizing point.
Watch from 03:14 to 05:08. Pay close attention to the calculation of total revenue at different points on the curve and how it peaks at the unitary elasticity point.
For a final reinforcement, the corresponding article provides a concise textual summary.
Own-Price Elasticity of Demand - CFA Exam Prep Courses
This section of the PrepNuggets article recaps the crucial relationship between the regions of the demand curve and total revenue.
Read the section titled 'Understanding Elasticity Variability' and pay special attention to the part on the 'Unitary Elasticity Point'.
3. Check Your Understanding
Now it's time to apply these rules, just as you would on the CFA exam. Your preference for practical problem-solving will be key here for long-term retention.
We'll use a worksheet that clearly defines the Total Revenue Test and then asks you to apply it.
[PDF] Microeconomics: Elasticity & Total Revenue Test
Please read the section defining the Total Revenue Test in this document. Then, use that knowledge to answer the first two practice questions that follow.
First, read the paragraph titled 'Total Revenue (TR) Test'. Then, move to the 'Practice Problems' and answer questions 1 and 2. You can check your answers against the solutions at the end of the PDF.
Let's walk through the logic for those problems together.
Question 1: True or false: If the elasticity of demand is greater than 1, then an increase in price will cause TR to decrease.
- Analysis: Elasticity greater than 1 means demand is elastic. The rule for elastic demand is that price and total revenue move in opposite directions. Therefore, an increase in price will cause total revenue to decrease.
- Answer: True. The quantity effect (fewer sales) is stronger than the price effect (higher price per sale).
Question 2: When demand is price inelastic, total revenues will _______ as the price falls.
- Analysis: Demand is inelastic. The rule for inelastic demand is that price and total revenue move in the same direction. Therefore, as the price falls, total revenue will also fall.
- Answer: Decrease. The price effect (lower price per sale) is stronger than the quantity effect (more sales).
Mastering this logic is essential for correctly interpreting pricing scenarios on the exam.
Conclusion
In this lesson, we connected the theoretical concept of elasticity to the practical business goal of managing revenue. By understanding whether demand is elastic, inelastic, or unit elastic, a firm can predict the impact of a price change on its total revenue.
Key Takeaways:
- Total Revenue (TR) is calculated as Price × Quantity.
- The Total Revenue Test links price changes to TR changes to determine elasticity.
- If demand is elastic (), price and total revenue move in opposite directions. To increase revenue, you should lower the price.
- If demand is inelastic (), price and total revenue move in the same direction. To increase revenue, you should raise the price.
- If demand is unit elastic (), total revenue is maximized.
Preview of the Next Lesson:
We have now thoroughly covered price elasticity. However, price is not the only factor that influences demand. In our next lesson, we will broaden our analytical toolkit by exploring two other important elasticity measures:
- Income Elasticity of Demand: How does a change in consumer income affect the quantity demanded?
- Cross-Price Elasticity of Demand: How does a change in the price of one good affect the quantity demanded of another?
This will allow us to classify goods as normal/inferior and substitutes/complements, adding another layer to your demand analysis skills.