Introduction
Hello! Welcome back to your CFA Level 1 Economics course.
In our last lesson, we focused on how markets find their balance point, or equilibrium. You learned how to determine the equilibrium price and quantity by finding the intersection of the demand and supply curves using graphs, schedules, and algebraic equations.
Today, we address the learning outcome: to analyze the effects of simultaneous shifts in demand and supply on equilibrium price and quantity. In the real world, market conditions are rarely static. Often, multiple factors change at once, causing both the demand and supply curves to shift simultaneously. This lesson will equip you with a systematic method to analyze these complex scenarios and predict the outcome—a crucial skill for interpreting economic events and for the CFA exam. We will discover that in such cases, the effect on one variable (price or quantity) is certain, while the effect on the other is often ambiguous, or "indeterminate."
1. The Core Logic: Breaking Down Complex Changes
When both the demand and supply curves shift, it can seem confusing at first. The key is to break the problem down into smaller, manageable pieces—a strategy you might appreciate from your experience with coding and mathematics. Instead of trying to visualize both shifts at once, we'll analyze the impact of each shift separately and then combine the results.
This short video from Jacob Clifford provides an excellent introduction to this powerful technique.
Double Shifts- Supply and Demand
Please watch this video, 'Double Shifts- Supply and Demand,' to learn a simple but effective trick for analyzing simultaneous shifts. Pay close attention to the method of analyzing each shift independently before combining them.
Watch the video from the beginning to 02:50. The instructor will introduce the concept, explain the 'double shift rule,' and walk you through a practice example.
As the video demonstrates, the process is:
- Analyze the demand shift: Determine the effect of the demand shift on equilibrium price (P) and quantity (Q) as if it were the only change.
- Analyze the supply shift: Determine the effect of the supply shift on P and Q as if it were the only change.
- Combine the results:
- If both shifts push a variable in the same direction, the final change in that variable is certain.
- If the shifts push a variable in opposite directions, the final change in that variable is indeterminate, meaning it depends on the relative magnitude of the shifts.
Let's use this method for the example in the video: Supply decreases (due to a rise in ingredient price) and Demand increases (due to a new fad).
- Step 1 (Demand ↑): Price ↑, Quantity ↑
- Step 2 (Supply ↓): Price ↑, Quantity ↓
- Step 3 (Combine):
- Price: Both shifts push the price up (↑ and ↑), so the price will definitely increase.
- Quantity: The demand shift pushes quantity up (↑), but the supply shift pushes it down (↓). The final result is indeterminate.
2. Why "Indeterminate"? A Deeper Graphical Look
The term "indeterminate" simply means we cannot know the outcome without more information. Specifically, we need to know the magnitude of the shifts. A graphical analysis makes this very clear.
Let's stick with the scenario where both demand and supply increase.
- The increase in demand pushes price up and quantity up.
- The increase in supply pushes price down and quantity up.
Combining these tells us that quantity will definitely increase, but the effect on price is indeterminate. The following video explains and visualizes why this is the case.
Simultaneous Change in Demand and Supply
This video, 'Simultaneous Change in Demand and Supply,' provides a more detailed graphical analysis. It uses the market for wind energy to show how different-sized shifts can lead to different outcomes for the price, even when the direction of the shifts is the same.
Watch from 00:35 to 09:16. The first part (until 02:04) explains the theory. The rest of the video uses graphs to demonstrate why quantity is certain to increase while price is indeterminate when both demand and supply increase. Notice how he draws two different scenarios to prove this point.
As the video demonstrated, when both demand and supply increase:
- If the increase in demand is stronger than the increase in supply, the upward pressure on price from the demand shift will dominate, and the price will rise.
- If the increase in supply is stronger than the increase in demand, the downward pressure on price from the supply shift will dominate, and the price will fall.
- If they shift by similar magnitudes, the price may not change at all.
This principle is highlighted in the image below, which shows two possible outcomes when demand increases and supply decreases.

3. A Systematic Framework for Analysis
For the CFA exam, you need to be able to quickly analyze any of the four possible combinations of simultaneous shifts. Using a summary table can be a very effective way to organize this information for study and recall.
Here is a matrix that summarizes all four scenarios.
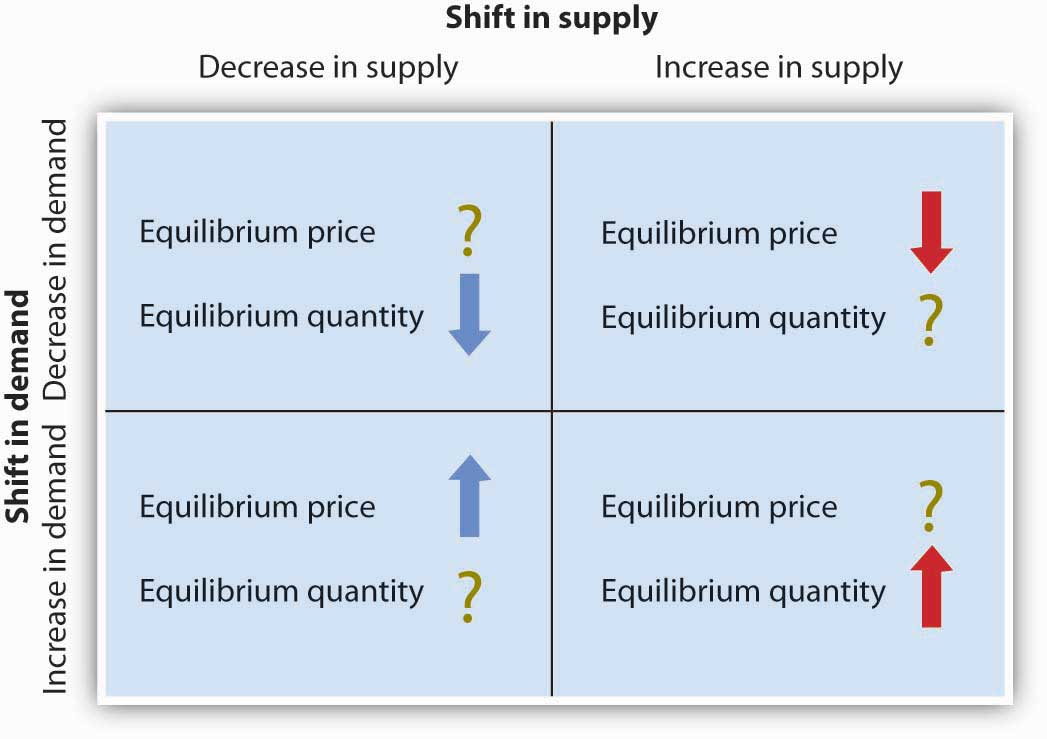
Let's use this matrix and our analytical method to work through a new case: Demand decreases and Supply increases.
- Demand ↓: Causes P ↓ and Q ↓.
- Supply ↑: Causes P ↓ and Q ↑.
- Combine:
- Price: Both shifts push the price down, so the equilibrium price certainly decreases.
- Quantity: Demand pushes quantity down, while supply pushes it up. The effect on equilibrium quantity is indeterminate.
This matches the bottom-right cell of the matrix. I encourage you to work through the other two cells on your own to solidify your understanding.
4. Practice for the Exam
Theory is essential, but practice is what builds confidence and speed for the exam. The following resource provides some real-world examples and CFA-style questions.
Demand, Supply, and Market Equilibrium - Prexams
This PDF document provides a concise summary and, more importantly, practice questions that mirror what you might see on the exam. We'll focus on the section that explains the logic and then test your knowledge with some multiple-choice questions.
First, please read the section under 'OBJECTIVE 9', starting from 'Changes in Equilibrium Price and Quantity' (page 70). Pay attention to the 'LEARNING TIP' and the example table provided. Then, turn to 'PRACTICE TEST I. MULTIPLE-CHOICE QUESTIONS' and try to answer questions 15, 22, 23, and 24 (on pages 75-76). After you've attempted them, check your answers against the provided solutions at the end of the document to see how you did.
This exercise will help you apply the framework we've developed in this lesson to concrete problems. This is exactly the kind of analysis you'll be expected to perform.
Conclusion
In this lesson, we tackled the complex but common scenario of simultaneous shifts in demand and supply. By breaking the problem down, you can confidently predict the impact on market equilibrium.
Key Takeaways:
- When both the demand and supply curves shift, one of the equilibrium variables (either price or quantity) will change in a definite direction.
- The other variable will be indeterminate, meaning its change depends on the relative magnitudes of the shifts in demand and supply.
- The most reliable method for analysis is to consider each shift's effect on price and quantity separately, then combine the results.
Preview of the Next Lesson:
Now that we have a firm grasp of how market equilibrium is established and how it changes, we can begin to evaluate market outcomes. In the next lesson, we will explore the concepts of consumer surplus, producer surplus, and total surplus. This will allow us to measure the benefits that buyers and sellers receive from participating in a market and introduce the important concept of market efficiency.