Introduction
Welcome back! In our last lesson, we categorized economic indicators as leading, coincident, or lagging, noting that both the unemployment rate and the inflation rate are typically lagging indicators. They confirm shifts in the economy after they have already begun.
Today, we will delve into the reasons for this lag and explore the specific relationship between the business cycle and these two crucial macroeconomic variables. Our learning outcome is to explain how business cycles affect inflation and cyclical unemployment. Understanding this dynamic is fundamental to interpreting the health of an economy and is a core concept for the CFA exam.
We will first examine how economic downturns create a specific type of unemployment, and then we'll analyze why inflation tends to rise during expansions and fall during contractions.
1. Cyclical Unemployment and the Business Cycle
When you hear news reports about unemployment rising during a recession, they are primarily referring to cyclical unemployment. To understand this concept precisely, it's important to distinguish it from other types of unemployment.
Chapter 9•Business Cycles, Unemployment, and Inflation•Julie Russell
Let's start with a clear breakdown of the three main types of unemployment. This video from TCC Connect Campus Faculty will define frictional, structural, and cyclical unemployment.
Watch the segment from 13:50 to 17:05. Focus on the definition of each type of unemployment, especially what makes cyclical unemployment unique.
As the video explained:
- Frictional Unemployment: Short-term and natural, as people move between jobs.
- Structural Unemployment: A mismatch between the skills workers have and the skills employers need, often due to technological or economic changes.
- Cyclical Unemployment: This is the key type for our discussion. It is caused directly by a downturn in the business cycle (a contraction or recession). When overall demand for goods and services falls, businesses produce less and consequently need fewer workers, leading to layoffs.
Therefore, cyclical unemployment is the deviation of the actual unemployment rate from the natural rate of unemployment (which is the sum of frictional and structural unemployment).
- During an expansion, as the economy grows, cyclical unemployment falls.
- During a contraction, as the economy shrinks, cyclical unemployment rises.
This relationship is why we say unemployment is counter-cyclical—it moves in the opposite direction to the business cycle.
Why is Unemployment a Lagging Indicator?
In the previous lesson, we classified unemployment as a lagging indicator. Why doesn't it move in lockstep with the economy? The answer lies in how businesses make staffing decisions.
[PDF] 7. Business Cycles - CFA Exam Prep
This PDF from Allen Resources provides a concise explanation of why labor usage lags the business cycle. This is a crucial concept for the CFA exam.
Please read the short section titled 'Resource Use through the Business Cycle' (page 109). Focus on the reasons why companies are slow to hire and fire employees.
The key reasons for the lag are:
- Hesitancy to Fire: Layoffs are costly (severance pay, potential morale damage) and firms don't want to lose trained workers if a downturn is short. They will first reduce overtime and cut temporary staff.
- Hesitancy to Hire: Hiring is also expensive and time-consuming. Firms wait for clear signs of a sustainable recovery before committing to new permanent employees. They will first increase overtime and hire temporary workers.
This behavior explains why the unemployment rate continues to rise even after a recession has technically ended and a recovery has begun.
2. Inflation and the Business Cycle
Now let's turn to inflation, which is the sustained increase in the general price level. Unlike unemployment, inflation is generally pro-cyclical, meaning it tends to move in the same direction as the business cycle.
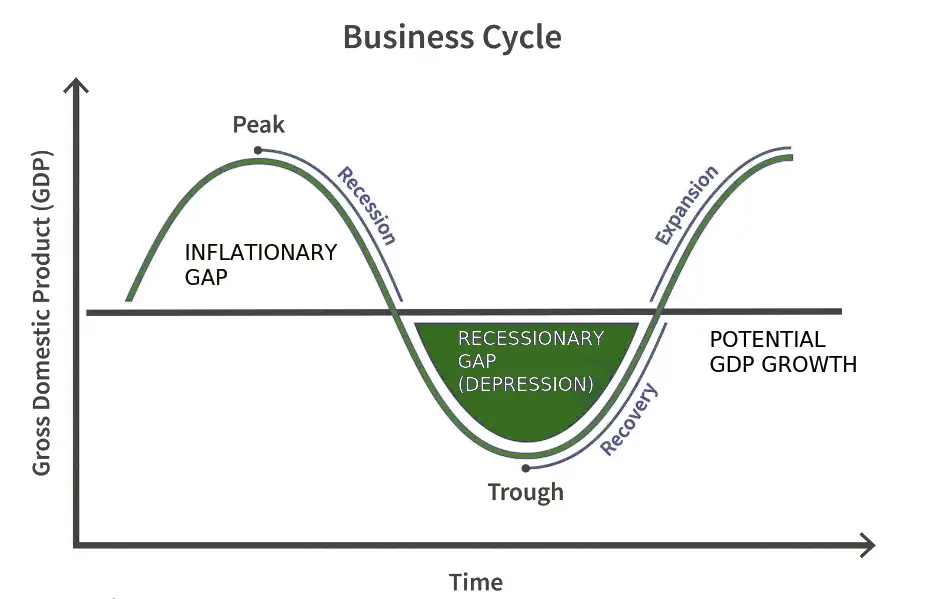
- During expansions, as the economy approaches and surpasses its potential output (creating an "inflationary gap"), price pressures build, and inflation accelerates.
- During contractions, as output falls below potential (creating a "recessionary gap"), price pressures ease, and the inflation rate slows down (a phenomenon called disinflation). In severe contractions, prices may even fall, which is called deflation.
To understand why this happens, we need to look at the two main drivers of inflation: demand-pull and cost-push inflation.
Chapter 9•Business Cycles, Unemployment, and Inflation•Julie Russell
This next video segment explains these two types of inflation using the aggregate demand and aggregate supply model, which you've seen in previous modules.
Watch from 37:28 to 43:21. Pay close attention to how a shift in aggregate demand causes demand-pull inflation and how a shift in aggregate supply causes cost-push inflation. Notice what happens to both price level and GDP in each case.
Here is how these forces work over the business cycle:
-
Demand-Pull Inflation in an Expansion: As the economy expands, consumer and business spending is strong. This high aggregate demand "pulls" prices up as firms find they can charge more for their products. This is the dominant form of inflation during a healthy expansion. As seen in the video, this is associated with rising GDP.
-
Cost-Push Inflation in a Late Expansion: As the expansion continues, the labor market tightens (unemployment falls) and workers can demand higher wages. Other input costs may also rise as resources become scarcer. Firms "push" these higher costs onto consumers in the form of higher prices to protect their profit margins. This pressure is strongest near the peak of the cycle.
During a contraction, the reverse happens. Aggregate demand weakens, reducing demand-pull pressures. Rising unemployment reduces workers' bargaining power, easing wage growth and cost-push pressures.
3. Summary of Effects Across the Cycle
Let's consolidate these relationships into a single table, which is a useful summary for exam preparation.
| Business Cycle Phase | Cyclical Unemployment | Inflation | Key Drivers |
|---|---|---|---|
| Expansion | Decreasing | Accelerating | Strong aggregate demand (demand-pull); later, rising input costs (cost-push). |
| Peak | At or near its minimum | At its highest rate | Economy at full capacity; significant resource and labor shortages. |
| Contraction | Increasing | Decelerating (disinflation) | Weak aggregate demand; increasing slack in labor and product markets. |
| Trough | At its maximum | At its lowest rate | Significant excess capacity and high unemployment put downward pressure on prices. |
Conclusion
In this lesson, we have explored the intricate dance between the business cycle, unemployment, and inflation. You now have the theoretical framework to explain why these variables behave the way they do as the economy fluctuates.
Key Takeaways:
- Cyclical unemployment is caused by downturns in the business cycle and is counter-cyclical.
- The unemployment rate is a lagging indicator because firms are slow to hire and fire, preferring to adjust hours and temporary staff first.
- Inflation is generally pro-cyclical, rising during expansions and falling during contractions.
- Demand-pull inflation arises from strong aggregate demand during an expansion.
- Cost-push inflation arises from rising input costs (like wages) as the economy reaches its peak.
Preview of the Next Lesson:
The inverse relationship we've observed—where unemployment falls as inflation rises during an expansion, and vice versa—is not just a coincidence. It is the basis for a famous macroeconomic concept. In our next lesson, we will explain the Phillips curve relationship between inflation and unemployment, which formally models this short-run trade-off.