Introduction
Hello! Welcome to the first lesson of our eighth module, where we begin our study of the broader macroeconomic environment.
In our last lesson, we saw how shifts in aggregate demand and aggregate supply create short-run fluctuations in the economy, resulting in inflationary gaps, recessionary gaps, or even stagflation. These are not just theoretical exercises; they are the engine that drives the real-world patterns of economic growth and decline.
Today, we will formalize this by exploring the business cycle. Our learning outcome is to describe the phases of a business cycle and the resource use patterns during each phase. Understanding the business cycle is fundamental for any financial analyst. It provides the context for firm performance, sector analysis, and asset allocation decisions. You'll learn to identify where the economy stands and what that implies for businesses and markets.
1. What is a Business Cycle?
At its core, the business cycle refers to the recurring, but not perfectly regular, ups and downs in the overall level of economic activity. Real GDP doesn't grow in a straight line; it fluctuates around a long-term trend. Let's start with a formal definition from the CFA curriculum.
Level 1 CFA Economics: Understanding Business Cycles-Lecture 1
This video from IFT provides a concise explanation of what a business cycle is, highlighting four key properties that are important to understand for the exam.
Watch the segment from 00:55 to 03:34. Pay close attention to the four points emphasized, especially the crucial distinction between a cycle being 'recurrent' but 'not periodic'.
As the video explained, these cycles are recurrent (they repeat) but not periodic (their length and intensity vary). This variability is why their analysis is so important for forecasting.
2. The Phases of the Business Cycle
Economists divide the business cycle into several distinct phases. While the exact terminology can vary slightly, the sequence is always the same.
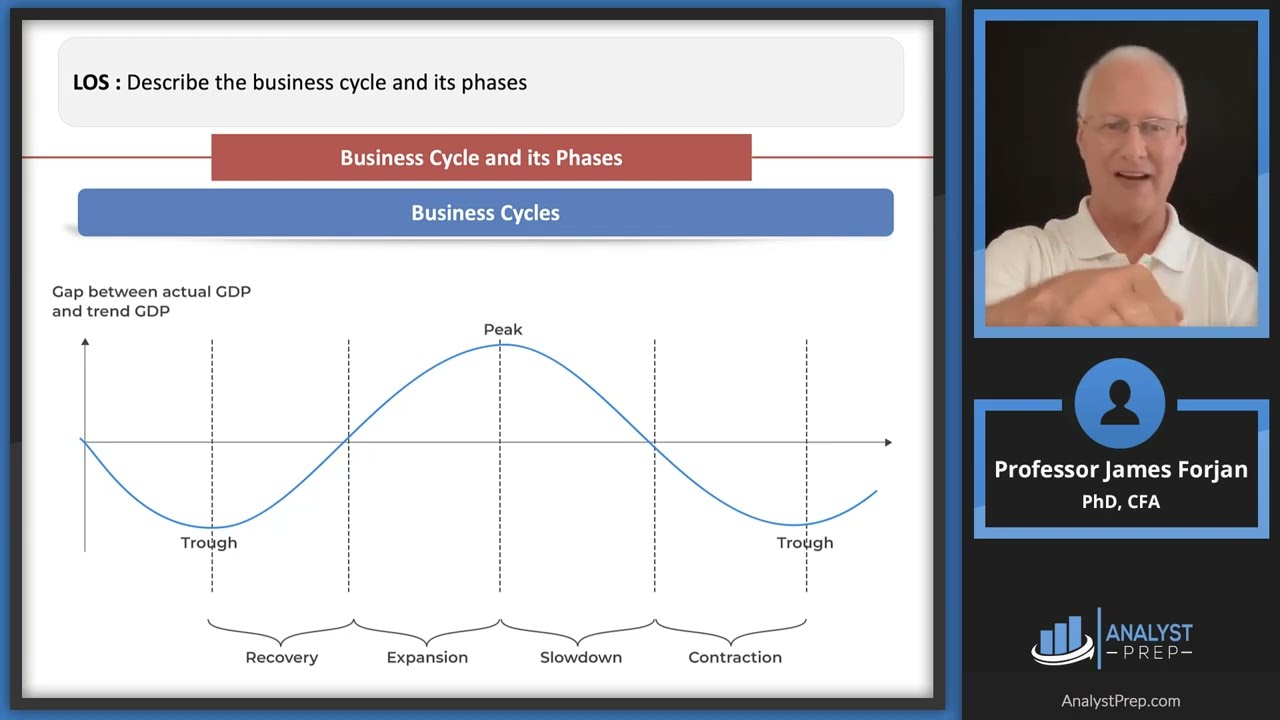
Based on the graph, we can identify these key phases:
- Trough: The lowest point of a business cycle. The decline in economic activity has ended, and a recovery is about to begin.
- Recovery/Early Expansion: Real GDP begins to increase after hitting its low point. Activity starts to pick up.
- Expansion: The phase of strong, sustained economic growth where real GDP is rising at an above-average rate.
- Peak: The highest point of a business cycle. Growth has reached its maximum rate and is about to turn negative.
- Slowdown/Late Expansion: Following the peak, the rate of economic growth begins to decelerate.
- Contraction (Recession): The phase where real GDP is decreasing. A commonly used, though informal, definition of a recession is two consecutive quarters of negative real GDP growth.
3. Resource Use Patterns Through the Cycle
The heart of business cycle analysis is understanding how different parts of the economy behave during each phase. For the CFA exam, you need to know the typical patterns for the use of labor, capital, and inventories.
Business Activity and Labor
Let's begin by looking at how firms adjust their overall activity and workforce as they move through the cycle.
Understanding Business Cycles (2025 CFA® Level I Exam – Economics – Learning Module 2)
Now that we have the phases, let's see how business activity and resource use change within each one. This video walks through the cycle, explaining how firms adjust their operations and workforce.
Watch from 09:28 to 11:49. Focus on how business activity, consumer spending, and especially hiring patterns differ in the recovery, expansion, slowdown, and contraction phases. A helpful summary table is shown near the end of this segment.
As you saw, firms are cautious. They slow down layoffs and add overtime in a recovery before committing to full-time hiring in an expansion. Similarly, they cut overtime before resorting to layoffs in a contraction. This cautious behavior has significant implications for the unemployment rate.
Capital Spending, Housing, and Trade
Beyond hiring, a key aspect of the business cycle is how firms and households adjust their major spending plans on long-lasting assets. Let's look at capital investment (by businesses), housing (by households), and international trade.
Understanding Business Cycles (2025 CFA® Level I Exam – Economics – Learning Module 2)
These large, often debt-financed purchases are highly sensitive to economic conditions and expectations about the future. The following segments detail their behavior.
Watch the segments on Capital Spending (16:15 - 19:01), Housing (19:01 - 20:29), and External Trade (20:29 - 22:59). For each area, note: Capital Spending: When do firms make heavy investments in new factories and equipment versus when do they cut back? Housing: How does demand for new homes, which is very sensitive to interest rates and consumer confidence, change through the cycle? External Trade: How do imports and exports respond to the health of the domestic economy?
Inventory Fluctuations
Finally, let's examine one of the most sensitive and telling components of the business cycle: business inventories. Firms try to manage their stock of goods to meet demand, but this is a difficult balancing act. Unplanned changes in inventory can be a strong signal of a turning point in the economy.
Understanding Business Cycles (2025 CFA® Level I Exam – Economics – Learning Module 2)
The relationship between inventories and sales is a critical indicator that analysts watch closely.
Watch from 22:59 to 26:45. Pay close attention to the concept of the inventory-to-sales ratio and how it behaves. Notice why an unplanned increase in this ratio as an expansion peaks is a bearish sign for the economy.
4. Summary of Resource Use
To consolidate this information, here is a summary table outlining the typical behavior of key economic activities during the main phases of the business cycle. This is an excellent tool for review.
| Phase | GDP Growth | Employment | Capital Spending | Inventories | Housing |
|---|---|---|---|---|---|
| Recovery | Stops declining, begins to rise | Layoffs end; firms use overtime before hiring | Low, but picking up on high-return projects | Firms rebuild depleted stocks; inventory-sales ratio falls | Activity picks up, driven by low interest rates & confidence |
| Expansion | Strong, above-average rate | Full-time hiring increases; unemployment falls | Strong growth, focused on capacity expansion | Stocks rise with sales; inventory-sales ratio is stable | Strong demand and construction; rising prices |
| Peak | Growth decelerates | Hiring slows; unemployment rate reaches a minimum | Growth slows, but still positive | Unplanned accumulation begins; inventory-sales ratio rises | Sales growth tapers off as interest rates may rise |
| Contraction | Negative growth (recession) | Overtime cut, then layoffs; unemployment rises | Significant cuts; projects delayed or cancelled | Firms liquidate unwanted stock; inventory-sales ratio declines | Significant drop in sales and construction |
Conclusion
In this lesson, we have defined the business cycle and mapped out its distinct phases. We've seen that the economy's movement through these phases—expansion, peak, contraction, and trough—is not random. It is accompanied by predictable patterns in how resources are used.
Key Takeaways:
- A business cycle consists of fluctuations in aggregate economic activity that are recurrent but not periodic.
- The four primary phases are expansion, peak, contraction, and trough (or recovery).
- Labor use is cautious: firms adjust hours before adjusting head-count, causing unemployment to lag behind the cycle.
- Capital spending and housing are highly cyclical, booming in expansions and contracting sharply in recessions.
- Inventory levels, particularly the inventory-to-sales ratio, are a very sensitive indicator of turning points in the economy.
Preview of the Next Lesson:
Now that we understand the landscape of the business cycle, a natural question arises: How do we know which phase we are in right now? And where are we heading next? In our next lesson, we will answer these questions by learning how to classify economic indicators as leading, lagging, or coincident. This will give us the tools to track the economy in real-time, just as a professional analyst would.