Introduction
Hello! Welcome back to our study of the firm's behavior.
In our last lesson, we focused on the physical constraints of production, culminating in the law of diminishing marginal returns. We established that as a firm adds more of a variable input (like labor) to a fixed input (like a factory), the extra output from each additional unit of the variable input will eventually decline.
This principle has a direct and critical impact on a firm's costs. If each new worker produces less than the one before, it means the cost of producing each additional unit of output must start to rise. Today, we will explore this financial side of the production coin. Our goal is to define and calculate total cost, fixed cost, variable cost, average cost, and marginal cost. Mastering these concepts is fundamental to understanding how firms make pricing and output decisions, a core topic in the CFA curriculum.
1. The Building Blocks: Fixed, Variable, and Total Costs
Every cost a firm incurs can be placed into one of two fundamental categories: fixed or variable.
-
Fixed Costs (FC): These are costs that do not change with the level of output. Think of rent for the factory, salaries for top management, or an insurance policy. Whether the firm produces 1 unit or 1,000 units, these costs remain the same in the short run.
-
Variable Costs (VC): These costs change directly with the level of output. Examples include raw materials, electricity to run machinery, and hourly wages for production workers. To produce more, you need more of these inputs, so your variable costs rise.
From these two, we derive the firm's Total Cost (TC), which is simply the sum of the two:
Even if a firm produces zero output (), it still has to pay its fixed costs, so its total cost will be equal to its fixed cost.
Another crucial concept is Marginal Cost (MC). This is the additional cost incurred by producing one more unit of output. It's calculated as the change in total cost divided by the change in quantity.
Since fixed costs don't change with output, the change in total cost is always equal to the change in variable cost. Therefore, you can also calculate marginal cost as .
Let's watch a video that walks through these core concepts with a clear example and a practice calculation.
Short-Run Costs (Part 1)- Micro Topic 3.2
This video from Jacob Clifford introduces the basic cost categories and shows how to calculate them. It provides a solid foundation for everything that follows.
Please watch the video from 00:34 to 03:04. As you watch, focus on: The definitions and examples of fixed and variable costs. How Total Cost (TC) and Marginal Cost (MC) are calculated from the initial data. At the 01:50 mark, pause the video and try to complete the calculations on a piece of paper before the answers are revealed.
2. Looking at Costs "Per Unit": The Average Costs
While total figures are important, it's often more useful for a manager to know the cost per unit of output. This is where average costs come in.
-
Average Fixed Cost (AFC): Total fixed cost divided by the quantity produced.
Since the numerator (TFC) is constant, AFC will always decrease as output (Q) increases. This is often called "spreading the overhead." -
Average Variable Cost (AVC): Total variable cost divided by the quantity produced.
-
Average Total Cost (ATC): Total cost divided by the quantity produced.
Just as , it's also true that Average Total Cost is the sum of Average Fixed Cost and Average Variable Cost.
This relationship is a useful check for your calculations.
Let's continue with the video, which now introduces these average cost concepts and provides another opportunity to practice.
Short-Run Costs (Part 1)- Micro Topic 3.2
This segment of the video explains the 'per-unit' costs and their formulas. It continues with the same data set, making it easy to build on what you've just learned.
Watch from 02:53 to 05:02. Pay close attention to the formulas for AFC, AVC, and ATC. When prompted at the 03:30 mark, pause and try to calculate the requested average costs.
3. Formalizing for the CFA Exam and Practice
Now that we have a solid intuitive and practical understanding, let's formalize these definitions as you would see them in the CFA curriculum. The following reading provides a concise summary of all the cost terms and formulas.
CFA Prerequisite - Economics Readings
This PDF is an excerpt from a CFA prep provider. It formally defines all the cost concepts and presents them in a table, which is a great reference for your studies.
Please read the section titled 'Total, Average, Marginal, Fixed, and Variable Costs' (page 60-61 of the PDF). Focus on Table 2-4, which summarizes all the formulas we've discussed. Also, review the definitions provided for each cost type to solidify your understanding.
Time to Practice
With the definitions and formulas fresh in your mind, let's apply them to a problem. This is the best way to ensure you can perform these calculations under exam conditions.
Below is a table showing the costs for a small manufacturing firm. Its fixed cost is $100 per day. Your task is to calculate the missing values.
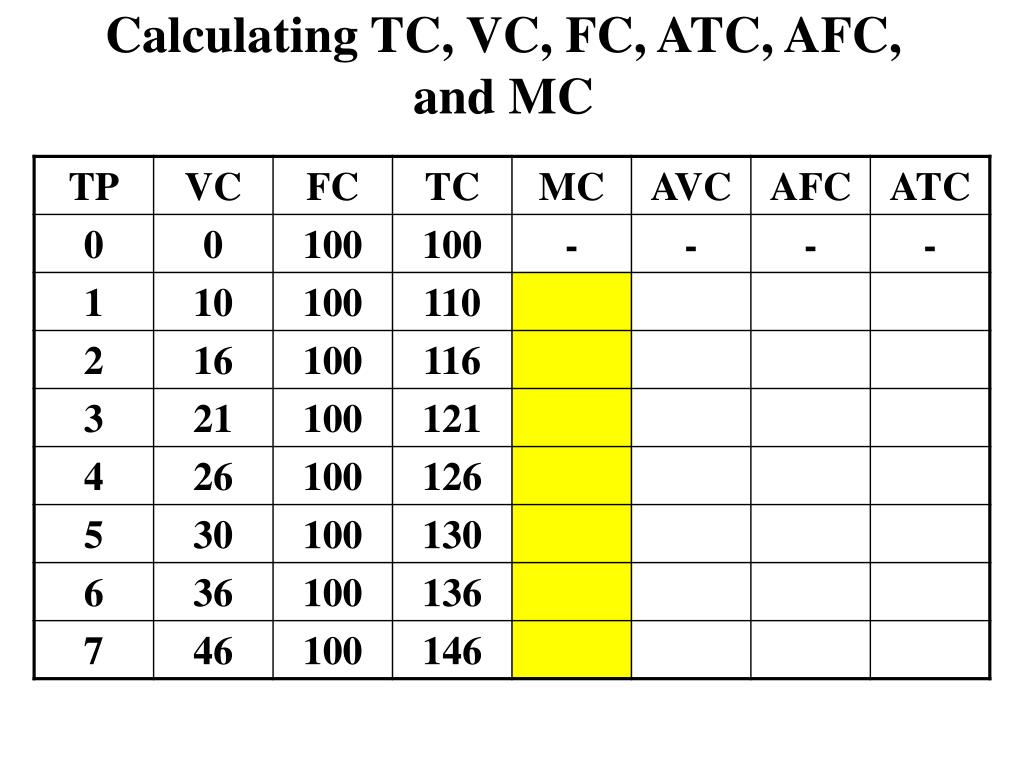
Instructions:
- Copy the table or work directly from the screen.
- Calculate Total Cost (TC) for each level of output. Remember, .
- Calculate Marginal Cost (MC) for each additional unit. Remember, . The first MC value will be the cost of going from Q=0 to Q=1.
- Calculate AFC, AVC, and ATC for each level of output (except Q=0, where they are undefined).
- Check your work for one of the rows: does AFC + AVC = ATC?
Take about 10-15 minutes to complete this. Once you're done, you can check your work against the solution below.
Click here to see the completed table and solution.
Here is the completed table:
| Total Product (Q) | Variable Cost (VC) | Fixed Cost (FC) | Total Cost (TC) | Marginal Cost (MC) | Average Variable Cost (AVC) | Average Fixed Cost (AFC) | Average Total Cost (ATC) |
|---|---|---|---|---|---|---|---|
| 0 | $0 | $100 | $100 | - | - | - | - |
| 1 | $50 | $100 | $150 | $50 | $50.00 | $100.00 | $150.00 |
| 2 | $80 | $100 | $180 | $30 | $40.00 | $50.00 | $90.00 |
| 3 | $100 | $100 | $200 | $20 | $33.33 | $33.33 | $66.67 |
| 4 | $130 | $100 | $230 | $30 | $32.50 | $25.00 | $57.50 |
| 5 | $180 | $100 | $280 | $50 | $36.00 | $20.00 | $56.00 |
| 6 | $260 | $100 | $360 | $80 | $43.33 | $16.67 | $60.00 |
Calculation Notes:
- TC: For Q=2, TC = $100 (FC) + $80 (VC) = $180.
- MC: For the 2nd unit (going from Q=1 to Q=2), MC = $180 - $150 = $30.
- AVC: For Q=4, AVC = $130 / 4 = $32.50.
- AFC: For Q=4, AFC = $100 / 4 = $25.00.
- ATC: For Q=4, ATC = $230 / 4 = $57.50.
- Check: At Q=4, does AFC + AVC = ATC? Yes: $25.00 + $32.50 = $57.50.
Finally, to prepare for the exam, it's helpful to be aware of common errors.
A-Level Economics — Production, Costs and Revenue
This resource provides a list of typical pitfalls students encounter when dealing with cost concepts. Being aware of these can help you avoid simple mistakes on the exam.
Read through the list in the 'Typical pitfalls and how to avoid them' section. Pay special attention to Pitfall #2 (Forgetting fixed costs) and Pitfall #8 (Vague cost terminology), as they are directly related to the calculations we just did.
Conclusion
In this lesson, we have systematically broken down a firm's short-run costs. We defined the core components and practiced the essential calculations required for the CFA exam.
Key Takeaways:
- Costs are categorized into Fixed Costs (FC), which don't vary with output, and Variable Costs (VC), which do.
- Total Cost (TC) is the sum of fixed and variable costs: .
- Marginal Cost (MC) is the cost of producing one additional unit: .
- Average Costs (AFC, AVC, ATC) provide a per-unit perspective.
- The key formulas are: , , and .
- A crucial relationship exists: .
Preview of the Next Lesson:
Now that you can define and calculate these costs, the next logical step is to understand their behavior visually. Why are the average cost and marginal cost curves typically U-shaped? How do they relate to each other? Crucially, how do they relate back to the production concepts of marginal and average product?
In our next lesson, we will explore the graphical relationships between these short-run cost curves. This will complete our understanding of short-run costs and pave the way for contrasting them with long-run costs, which is the subject of the following learning outcome.