Welcome to our next lesson. In our previous session, we explored the concept of symmetry, learning how to identify even, odd, and periodic functions from their graphs and algebraic definitions. These properties are not just abstract curiosities; they reveal deep structural patterns in functions.
Today, we will begin building our "library" of fundamental functions, a core part of your calculus journey. This lesson directly addresses the learning outcome: to identify and sketch polynomial, power, and rational functions by analyzing their key features. We will start with the simplest building blocks—power functions—and see how they combine to form polynomials. We'll then investigate rational functions, which are ratios of polynomials. The concepts of symmetry and end behavior from our last lesson will be immediately useful here, providing the first clues for sketching these graphs.
Power and Polynomial Functions: The Building Blocks
Let's begin with the most basic type of polynomial: a power function. These are the fundamental units from which more complex polynomials are built.
A power function has the form , where and are real numbers. For our current focus on polynomials, we will primarily consider cases where is a non-negative integer.
This first section from Baylor University's calculus supplement formally defines power functions and gives several examples.
Please read the introductory part, focusing on the definition of a power function. Read from the beginning down to the section titled "Identifying End Behavior of Power Functions," including the solution for Example 1. This will help you recognize the structure f(x) = kx^p.
The key to understanding power functions—and, by extension, all polynomials—is their end behavior: what happens to the function's values as approaches positive or negative infinity ( or ). This behavior is determined entirely by two things:
- Whether the power is even or odd.
- Whether the coefficient is positive or negative.
This should sound familiar! The even/odd nature of the exponent directly relates to the even/odd symmetry we discussed in the last lesson. Professor Leonard provides an excellent conceptual overview of this connection.
Power Functions (Precalculus - College Algebra 28)
This video, "Power Functions," explains the fundamental shapes and properties of power functions.
Watch the first two segments to build a strong intuition: Introduction: The instructor explains why power functions are crucial for understanding the end behavior of any polynomial. Even vs. Odd Power Functions: This is a key section. Pay close attention to how the graph's shape and symmetry are determined by whether the exponent is even or odd. Note the "key points" that all even and all odd power functions share.
As you saw in the video, the end behavior of a power function (where is a positive integer) follows four predictable patterns:
- p is even, k > 0: Graph goes up on both ends (e.g., ). As , .
- p is even, k < 0: Graph goes down on both ends (e.g., ). As , .
- p is odd, k > 0: Graph goes down on the left, up on the right (e.g., ). As , ; as , .
- p is odd, k < 0: Graph goes up on the left, down on the right (e.g., ). As , ; as , .
This is the cornerstone for analyzing more complex polynomials. A polynomial function is simply a sum of power functions with non-negative integer exponents.
When sketching a polynomial, the most important term is the leading term, . This is the power function with the highest exponent, and it single-handedly dictates the polynomial's end behavior. As becomes very large (positive or negative), the leading term grows much faster than all other terms, dominating the function's behavior.
The following reading formalizes these concepts.
This part of the Baylor text defines polynomials and explains how to use the leading term to determine end behavior.
Please read the following three sections: "Identifying Polynomial Functions": Read the definition. "Identifying the Degree and Leading Coefficient...": This section is crucial. Understand the definitions of degree, leading term, and leading coefficient. "Identifying End Behavior of Polynomial Functions": This section connects everything. Read the main principle and look at the examples in Table 3.
Sketching Polynomials: Zeros and Multiplicity
End behavior gives us the "big picture" of the graph. To fill in the details, we need to find where the graph crosses the axes, particularly the x-axis. These x-intercepts are called the zeros or roots of the polynomial.
To find the zeros, we set and solve for . If the polynomial is factored, this is straightforward. For example, if , the zeros are and .
The multiplicity of a zero is the number of times its corresponding factor appears. This tells us how the graph behaves at the x-intercept:
- Multiplicity 1: The graph crosses the x-axis cleanly (like a line).
- Multiplicity 2 (or any even number): The graph touches the x-axis and "bounces" off (like a parabola).
- Multiplicity 3 (or any odd number > 1): The graph crosses the x-axis but flattens out as it does so, creating an "S-curve" shape (like ).
The following video provides an excellent guide to using end behavior, zeros, and multiplicities to sketch a polynomial.
Graphing Polynomial Functions Using End Behavior, Zeros, and Multiplicities
This video from Mario's Math Tutoring demonstrates the full process of sketching a polynomial.
Watch the following segments carefully, as they walk through a complete example: Introduction and Zeros: How to find the x-intercepts from a factored polynomial. End Behavior: How to determine the left- and right-hand behavior using the leading coefficient and degree. Multiplicities: This is a key part. Learn how the multiplicity of a zero affects the graph's shape at the x-axis. Putting It All Together: Watch how all these pieces of information are combined to create a sketch.
To summarize the process for sketching a polynomial:
- End Behavior: Find the degree and leading coefficient. Determine if the graph rises or falls on the far left and far right.
- Intercepts: Find the y-intercept by calculating . Find the x-intercepts (zeros) by setting and solving.
- Multiplicities: Determine the multiplicity of each zero to know if the graph crosses or bounces at the x-axis.
- Sketch: Start from one end, draw the graph through the intercepts with the correct behavior, and connect to the other end.
Rational Functions: Ratios and Asymptotes
Now we turn to rational functions, which are functions formed by the ratio of two polynomials: .
Their graphs can be more complex than polynomials. The key new features are asymptotes: lines that the graph approaches but typically does not cross.
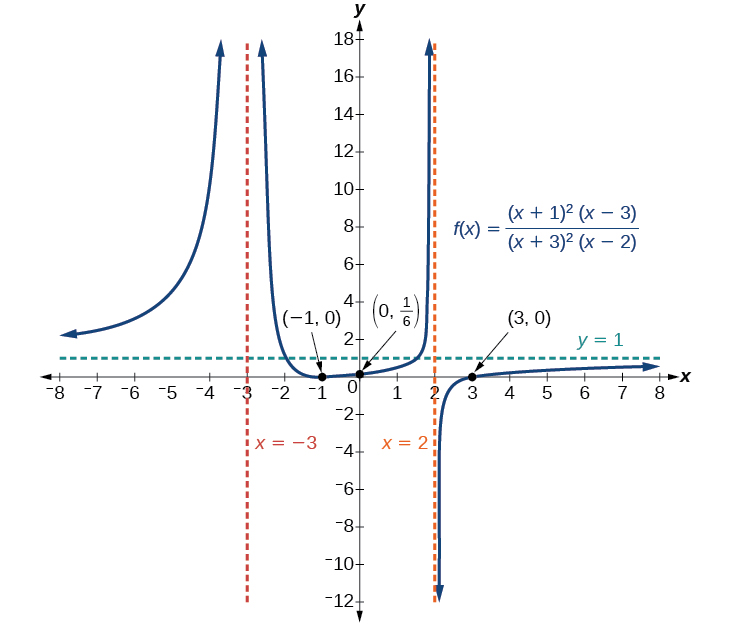
Analyzing a rational function involves a systematic checklist. The following resource provides a comprehensive step-by-step guide.
Tutorial 40: Graphs of Rational Functions
This tutorial from West Texas A&M University provides a fantastic, structured approach to graphing rational functions.
First, read through the six steps for graphing rational functions. Start at the section titled "Graphing Rational Functions" and read each of the six steps carefully. This will give you a complete roadmap. Afterward, we will break down the most important steps.
Let's focus on the most critical features from that guide: asymptotes and intercepts.
1. Vertical Asymptotes and Holes
A vertical asymptote occurs where the function is undefined—that is, where the denominator . However, there's a catch. You must first simplify the fraction. If a factor cancels out from both the numerator and denominator, there is a hole in the graph at , not a vertical asymptote.
- Vertical Asymptote: Occurs at if and after simplification.
- Hole: Occurs at if the factor can be cancelled from the numerator and denominator.
2. Horizontal Asymptotes
Horizontal asymptotes describe the end behavior of the function. You find them by comparing the degree of the numerator, deg(P), to the degree of the denominator, deg(Q).
deg(P) < deg(Q): The horizontal asymptote is the x-axis, .deg(P) = deg(Q): The horizontal asymptote is .deg(P) > deg(Q): There is no horizontal asymptote.
3. Slant (Oblique) Asymptotes
In the special case where deg(P) is exactly one more than deg(Q), the graph has a slant asymptote. This is a slanted line that the graph approaches. You find the equation of this line by performing polynomial long division of by . The quotient (ignoring the remainder) is the equation of the slant asymptote.
4. Intercepts
- y-intercept: Find .
- x-intercepts: Set the numerator and solve. (These are the zeros of the numerator).
The following resource provides clear explanations and examples for finding each type of asymptote.
Tutorial 40: Graphs of Rational Functions
This guide provides the specific rules for finding each type of asymptote.
Read the following three sections to master these rules: Vertical Asymptote: Focus on how to find the values of x that make the simplified denominator zero. Notice the discussion of a cancelled factor in Example 3. Horizontal Asymptote: Study the two cases based on the degrees of the numerator and denominator. Oblique or Slant Asymptote: Understand when this occurs and how it's found using long division.

By systematically finding the domain, intercepts, holes, and all asymptotes, you can piece together an accurate sketch of any rational function.
Conclusion
In this lesson, we added three major families of functions to your mathematical library: power, polynomial, and rational functions. You learned to deconstruct their formulas to predict their graphical behavior.
Key Takeaways:
- Power Functions (): Their end behavior is dictated by the parity (even/odd) of the exponent and the sign of the coefficient .
- Polynomial Functions: They are sums of power functions. Their end behavior matches that of their leading term. Their local behavior is governed by the zeros (x-intercepts) and their multiplicities, which determine if the graph crosses or bounces at the axis.
- Rational Functions (): Their graphs are characterized by asymptotes.
- Vertical asymptotes occur where the simplified denominator is zero.
- Horizontal or slant asymptotes describe the end behavior and are found by comparing the degrees of the numerator and denominator.
- Holes occur at x-values corresponding to factors that cancel out.
In our next lesson, we will move on to the next learning outcome: Graph complex functions by applying horizontal and vertical shifts, stretches, and reflections to parent functions. The "parent" functions we've studied today—like , , and —will serve as the foundation upon which we will build more intricate graphs using these transformations.