Hello! In our last lesson, we explored exponential and logarithmic functions, establishing them as fundamental inverse pairs in our growing library of functions. We ended by noting that these functions can serve as "parents" for creating more complex graphs.
Today, we will delve into that very idea. This lesson is designed to help you master the learning outcome: to graph complex functions by applying horizontal and vertical shifts, stretches, and reflections to parent functions. This is a powerful and efficient technique that allows you to sketch a wide variety of graphs quickly by understanding their underlying structure, rather than laboriously plotting points. This skill of visual decomposition is invaluable in calculus, especially when we start analyzing the relationship between a function and its derivative.
From Parent Functions to Transformed Graphs
The core idea of transformations is simple: we start with a basic, well-understood function, which we call a parent function, and then systematically alter it. You've already built a solid library of these parent functions.
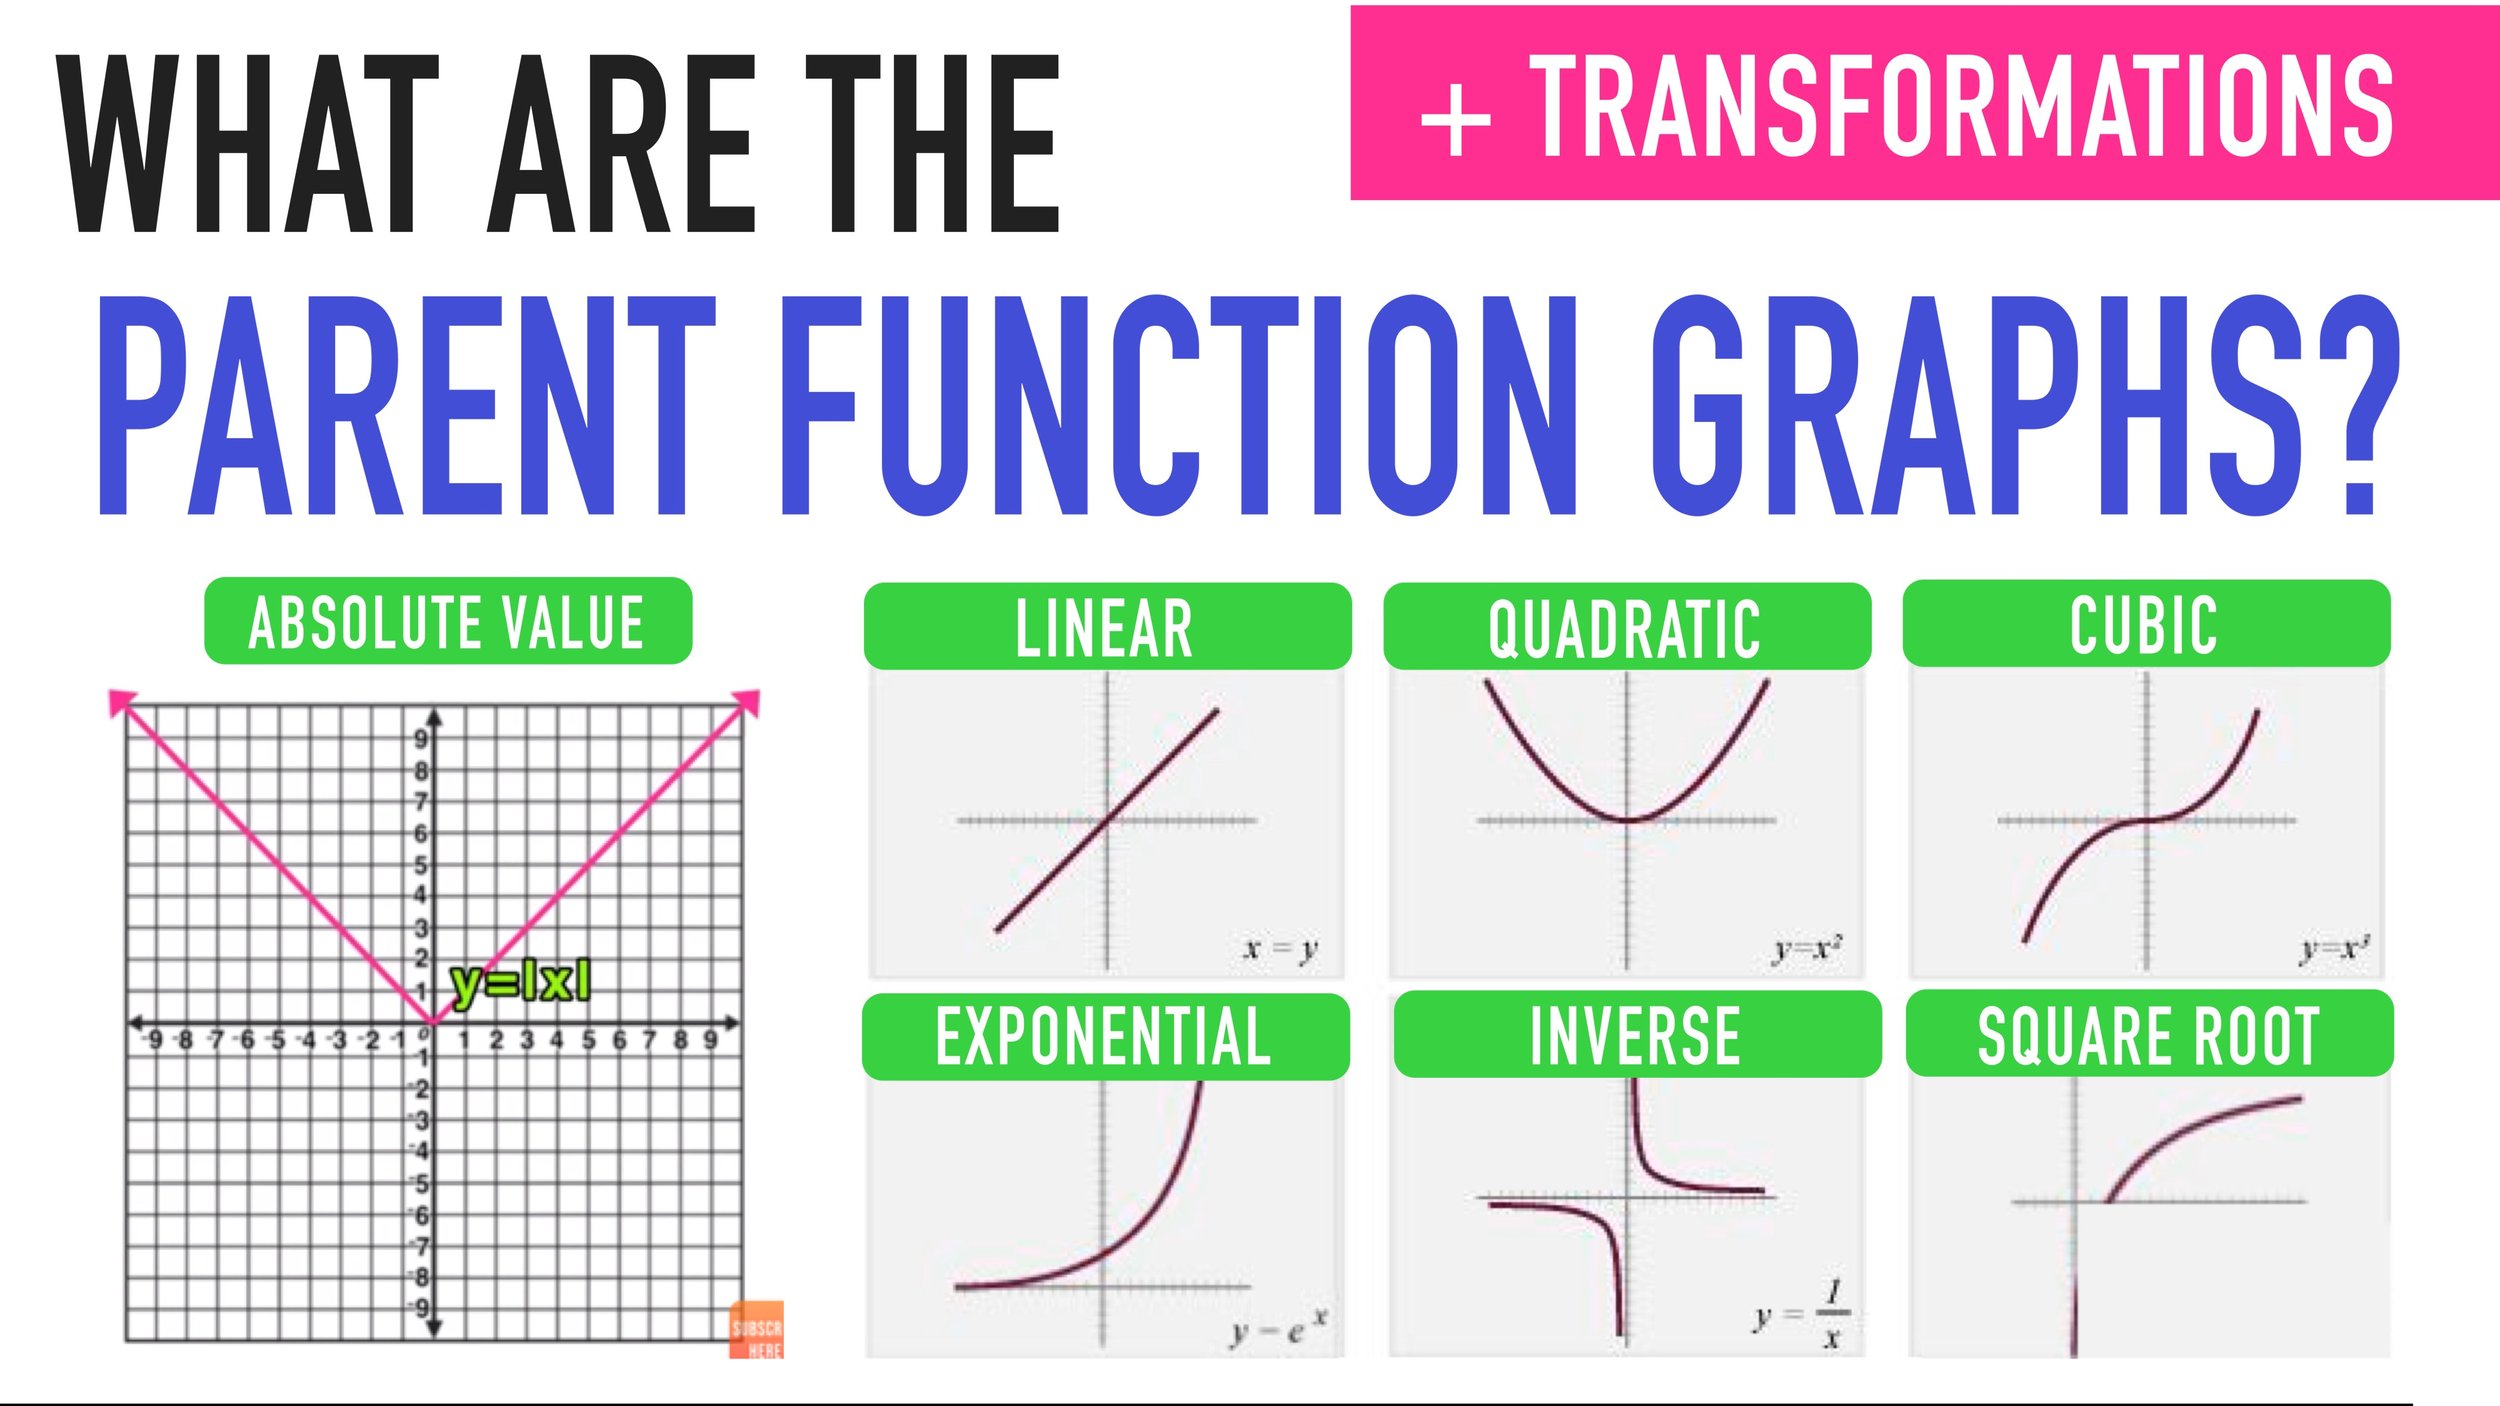
We will apply a sequence of operations to these parent functions to shift, stretch, compress, or reflect their graphs, resulting in a new, transformed function. There are four fundamental types of transformations.
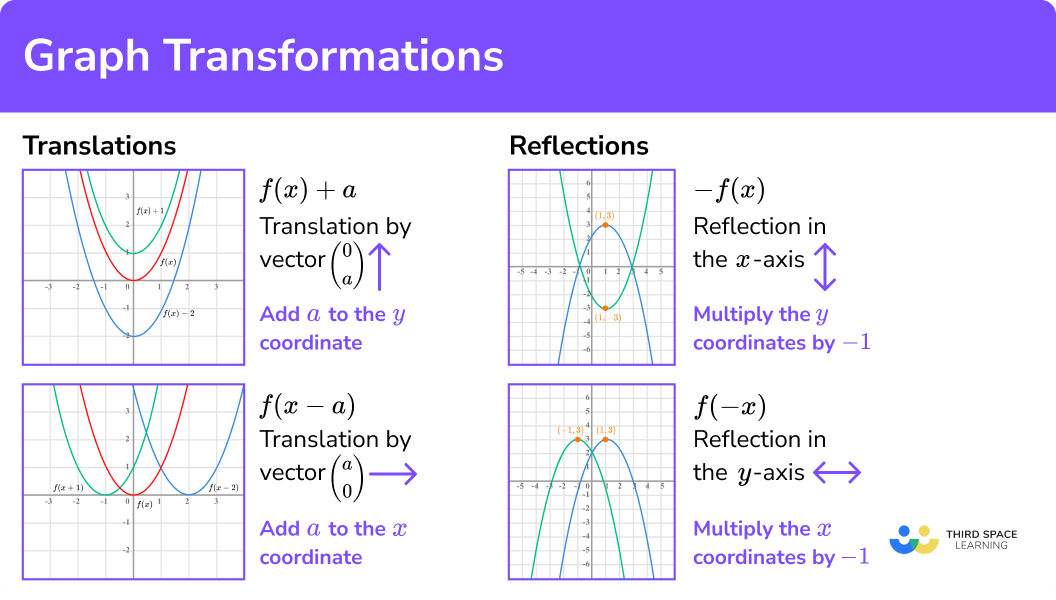
1. Shifts (Translations)
Shifts, or translations, move the entire graph without changing its shape or orientation. Professor Leonard provides an excellent conceptual explanation of why these shifts work the way they do.
Introduction to Graph Transformations (Precalculus - College Algebra 14)
This video by Professor Leonard explains the logic behind vertical and horizontal shifts.
Please watch the following segments: Vertical Shifts: Watch from the beginning to the end of the section. The key idea is that adding a constant outside the function (e.g., f(x) + 3) directly affects the output (y-value), moving the graph up or down. Horizontal Shifts: Watch the next segment, from the start of the section until the combined example. Pay close attention to why adding a constant inside the function (e.g., f(x+2)) has a counter-intuitive effect. It shifts the graph left, as a smaller x is now needed to produce the same input to the function.
As the video explained, we can summarize the rules for shifts as follows:
-
Vertical Shift: Given a function , the graph of is the graph of shifted:
- Up by units if .
- Down by units if .
-
Horizontal Shift: Given a function , the graph of is the graph of shifted:
- Right by units if . (e.g., shifts right by 3).
- Left by units if . (e.g., which is shifts left by 2).
2. Stretches, Compressions, and Reflections
These transformations change the shape or orientation of the graph.
Vertical Transformations: y = a * f(x)
Multiplying the entire function by a constant a affects the y-coordinates of every point on the graph.
- Vertical Stretch/Compression:
- If , the graph is stretched vertically by a factor of . The graph appears narrower.
- If , the graph is compressed vertically by a factor of . The graph appears wider.
- Reflection across the x-axis:
- If , the graph is reflected across the x-axis. This is because all positive
y-values become negative and vice-versa.
- If , the graph is reflected across the x-axis. This is because all positive
Horizontal Transformations: y = f(b * x)
Multiplying the input x by a constant b affects the x-coordinates. Like horizontal shifts, these are often counter-intuitive.
- Horizontal Stretch/Compression:
- If , the graph is compressed horizontally by a factor of .
- If , the graph is stretched horizontally by a factor of .
- Reflection across the y-axis:
- If , the graph is reflected across the y-axis.
Professor Leonard also explains these concepts clearly.
Introduction to Graph Transformations (Precalculus - College Algebra 14)
This video segment covers stretches, compressions, and reflections.
Please watch these two parts: Vertical Stretches and Compressions: This section explains how multiplying the output of a function scales it vertically. Reflections: This covers how negative signs, both inside and outside the function, cause reflections across the y-axis and x-axis, respectively.
A Systematic Approach to Combining Transformations
Real-world functions often involve multiple transformations. To handle this complexity, we need a systematic approach. A transformed function can generally be written in the form:
Here, f(x) is the parent function, and a, b, h, k are the parameters that control the transformations. The following resource provides a fantastic, structured method for analyzing these combined transformations.
This article presents a clear, algorithmic way to deconstruct and graph functions with multiple transformations.
Please read the first three main sections of the article: A consistent way to read a transformed function: Focus on how each parameter (a, b, h, k) in the general form corresponds to a specific transformation. Choosing an order for graphing: This short section proposes a reliable workflow. Mapping key points step-by-step: This is the most crucial part. It introduces a powerful point-mapping formula that handles all transformations at once.
The most powerful tool from this reading is the point-mapping formula. If a point (x, y) is on the graph of the parent function y = f(x), the corresponding point (X, Y) on the transformed graph g(x) = a f(b(x - h)) + k is given by:
This formula provides a systematic, almost algorithmic way to transform a graph. You identify a few key points on the parent graph, apply this mapping to find their new locations, and then sketch the transformed graph through the new points.
Worked Example: Transforming the Natural Logarithm
Let's apply this method to graph the function starting from the parent function .
1. Rewrite in Standard Form:
First, we must rearrange to match the standard form .
2. Identify Parameters and Parent Function:
- Parent Function:
- Parameters: , , ,
This tells us we have:
- A reflection across the x-axis ().
- A reflection across the y-axis ().
- A horizontal shift right by 2 ().
- A vertical shift up by 3 ().
3. Identify Key Features of the Parent Function:
The graph of has:
- A key point at .
- Another point at (since ).
- A vertical asymptote at .
4. Apply the Point-Mapping Formula:
The mapping is: .
-
Transform the point :
The new point is . -
Transform the point :
The new point is . -
Transform the asymptote :
Since the asymptote is a vertical line defined by an x-value, we apply the horizontal part of the mapping to it.
New asymptote: . The new vertical asymptote is .
5. Sketch the Graph:
Plot the new asymptote at . Plot the transformed points and . Then, draw the logarithmic curve through these points, approaching the asymptote. The double reflection means the graph will be in the top-left quadrant relative to its starting point.
This systematic process allows you to construct a complex graph with confidence, piece by piece.
Conclusion
In this lesson, we developed a comprehensive toolkit for transforming functions. By understanding how shifts, stretches, and reflections are encoded in a function's equation, you can now visualize and sketch complex graphs from simple parent functions.
Key Takeaways:
- Transformations include shifts (translations), stretches/compressions, and reflections.
- Changes outside the function
f(...)cause vertical transformations. - Changes inside the function
f(...)cause horizontal transformations, which often behave opposite to intuition. - Any combination of these transformations can be represented by the general form .
- The most reliable way to graph a transformed function is to use the point-mapping formula on key points from the parent graph.
In our next lesson, we will continue exploring ways to build new functions from old ones. We will move beyond transformations to investigate how functions can be combined using arithmetic operations (addition, subtraction, multiplication, division) and the powerful concept of function composition.