In our last lesson, you transformed your index.html code into a live webpage using both manual methods and the professional Live Server workflow. You now have a seamless process for writing code and instantly seeing the results. This lesson focuses on looking "under the hood" to see how the browser understands and displays your code.
Every modern web browser includes a powerful suite of developer tools, often called "DevTools." These tools are essential for web development, allowing you to inspect the live HTML, experiment with styles, and diagnose problems. Today, you will learn how to access and use the most fundamental part of these tools: the HTML inspector. This will empower you to see your page not just as a user, but as a developer.
What Are Browser Developer Tools?
When a browser opens your index.html file, it doesn't just display the text you wrote. It reads and parses your HTML tags to build an internal, tree-like structure of the page's contents. This structure is called the Document Object Model, or DOM. The developer tools give you a direct window into this live DOM.
For a clear and authoritative introduction, let's turn to the Mozilla Developer Network (MDN), a key resource for web developers.
What are browser developer tools? - MDN Web Docs - Mozilla
This article provides an excellent overview of what developer tools are and introduces the 'Inspector', which is the tool we will be focusing on.
First, read the introduction for a summary of what these tools do. Then, jump to the section "The Inspector: DOM explorer and CSS editor" and read the first paragraph, which explains how the Inspector shows the page's HTML at runtime.
The key takeaway is that the developer tools allow you to see the page's structure as the browser sees it, and even make temporary changes to see their effect instantly.
Opening the Developer Tools
There are several easy ways to open the developer tools in your browser. While the specifics can vary slightly between browsers, the core methods are universal. We'll focus on Google Chrome, a very popular choice for web development.
You can open the DevTools in any of these ways:
- From the Menu: Navigate through the browser's menu. In Chrome, this is the three-dot menu at the top-right, then
More Tools>Developer Tools.
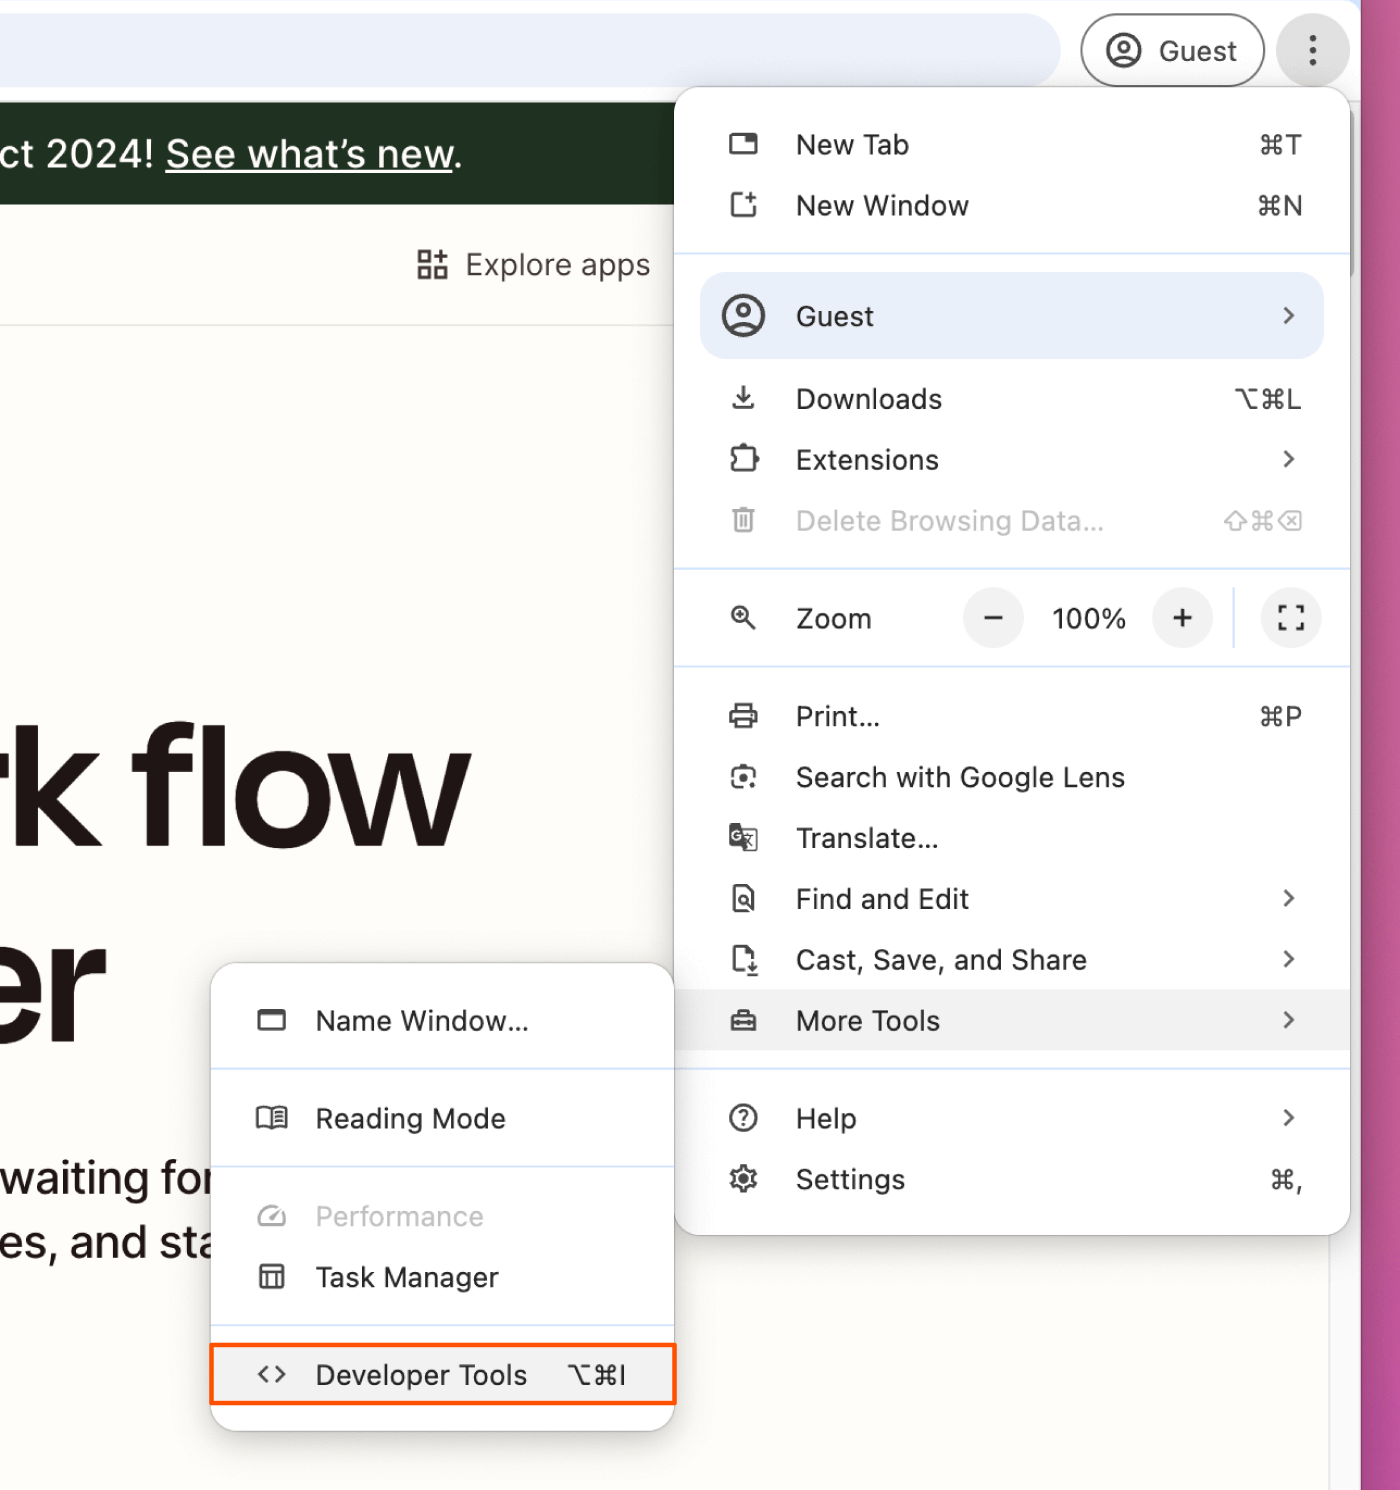
-
By Right-Clicking: Right-click on any part of the webpage you want to inspect and select
Inspectfrom the context menu that appears. This is a very efficient method because it will automatically open the tools and highlight the HTML for the exact element you clicked on. -
With a Keyboard Shortcut:
- On Windows and Linux: Press
Ctrl+Shift+IorF12. - On macOS: Press
Cmd+Opt+I.
- On Windows and Linux: Press
For a quick visual demonstration of these methods, the following video is very helpful.
Use Chrome's Inspect Tool Effectively
This short video by Julia F Morgado quickly demonstrates the different ways to open the inspector tool in Chrome.
Watch the section that covers four ways to open the tool, which demonstrates the right-click, menu, and keyboard shortcut methods.
Now, try it yourself! Open the index.html page you've been working on (using Live Server) and use one of these methods to open the developer tools.
Exploring the Elements Panel
Once you open the DevTools, you'll see a panel with several tabs like Elements, Console, Sources, etc. For now, we are only interested in the Elements panel, which is usually the one that opens by default.

The Elements panel is your window into the DOM. You can see your <html>, <head>, and <body> tags, just as you wrote them in VS Code.
Let's explore the interactive nature of this panel. This is where the tool becomes truly powerful for learning and debugging.
- Hover to Highlight: As you move your mouse over different HTML tags in the Elements panel, you will see the corresponding part of the webpage get highlighted.
- Select to Inspect: Click the "select element" icon (it looks like a square with a cursor arrow) in the top-left corner of the DevTools panel. Then, click on any part of your webpage. The Elements panel will automatically jump to and highlight the HTML code for that element.
The same video we just watched has an excellent segment demonstrating this.
Use Chrome's Inspect Tool Effectively
This part of the video clearly shows the link between the code in the Elements panel and the visual page.
Please watch the section from "down here is the source html". It demonstrates how hovering over code highlights the page element and how to use the selection tool.
Making Live (but Temporary) Edits
One of the most useful features of the Elements panel is the ability to edit your HTML directly in the browser. This allows you to experiment with changes without having to switch back to your code editor and save the file.
Let's try it:
- In the Elements panel, find the
Hello, world!text you added inside the<body>. - Double-click on the text
Hello, world!. It should become an editable text field. - Change it to something else, like
Inspecting my page!, and pressEnter. You will see the text on your webpage update instantly.
You can also add or delete entire elements. However, there's a crucial detail to understand: these changes are not permanent. They only exist in the browser's current session. If you refresh the page, the browser will reload your original index.html file, and all your live edits will disappear.
This feature is for quick experiments and debugging, not for writing your actual code. The "source of truth" remains your .html file in VS Code.
The final part of the video we've been using demonstrates this concept perfectly.
Use Chrome's Inspect Tool Effectively
This segment shows how to make live edits and confirms that they disappear upon refreshing the page.
Watch the final part of the demonstration, focusing on how to alter the code. Pay close attention to the explanation at the end about what happens when you refresh the page.
Conclusion
In this lesson, you've learned how to use the browser's developer tools to look behind the scenes of a webpage. This is a fundamental skill for any web developer, helping you understand, debug, and learn from your own code and the code of others.
Key Takeaways:
- Every browser has a set of Developer Tools (DevTools) for inspecting and debugging webpages.
- You can open DevTools using a keyboard shortcut, the browser menu, or by right-clicking and selecting "Inspect."
- The Elements panel shows the live Document Object Model (DOM), which is the browser's structural representation of your HTML.
- You can inspect elements by hovering over code or using the selection tool to click on the page.
- It's possible to make temporary edits to the HTML directly in the Elements panel to experiment with changes, but these are lost on page refresh.
So far, your code has been very simple. As your HTML documents grow, keeping them clean and organized becomes vital. In our next lesson, we'll address this by learning how to apply consistent indentation to your code, making it easier to read both in your editor and in the DevTools inspector you've just learned to use.