Welcome to the third lesson in our foundational module. In our previous session, we established a crucial practice for machine learning: splitting our data into training, validation, and test sets. This ensures we can train our model, tune its hyperparameters, and finally obtain an unbiased estimate of its performance on unseen data—its generalization error.
Today, we will delve deeper into the nature of this generalization error. Our goal is to understand why a model might perform well or poorly on new data. This brings us to a central concept in machine learning, and the focus of this lesson: to describe the bias-variance tradeoff and its implications for model generalization. By decomposing a model's error into two fundamental components, bias and variance, we gain a powerful diagnostic framework for understanding and addressing the common pitfalls of underfitting and overfitting.
The Anatomy of Error: Bias and Variance
At a high level, the total error of a machine learning model on unseen data can be thought of as stemming from three sources:
- Bias: This represents the error from erroneous assumptions in the learning algorithm. High bias can cause an algorithm to miss the relevant relations between features and target outputs. We can think of it as a systematic error or the model's inherent inflexibility. A model with high bias is underfitting the data.
- Variance: This represents the error from sensitivity to small fluctuations in the training set. High variance can cause an algorithm to model the random noise in the training data, rather than the intended outputs. It reflects the model's instability. A model with high variance is overfitting the data.
- Irreducible Error: This error is due to the inherent noise in the data itself. No matter how good our model is, we cannot reduce this error. It represents a lower bound on the error for any model.
The "tradeoff" comes from the fact that, for a given model, decreasing one of these error components often leads to an increase in the other.
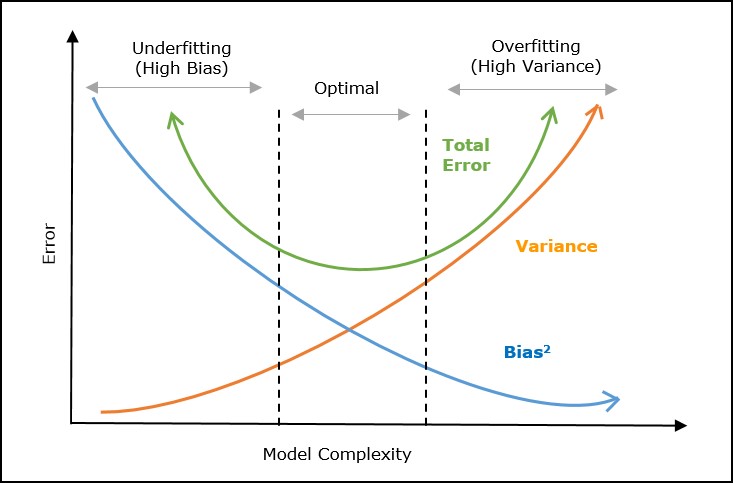
To build an initial intuition, let's explore an interactive article that visualizes these concepts.
Bias Variance Tradeoff - MLU-Explain
This interactive article from MLU-Explain provides an excellent visual and intuitive introduction to the concepts of underfitting, overfitting, bias, and variance.
Please read through the following sections and engage with the interactive elements: Start with Low Complexity & Underfitting. This demonstrates a high-bias model. Continue to High Complexity & Overfitting, which shows a high-variance model. Read the section The Bias Variance Trade-off to see how these concepts come together to form the classic U-shaped error curve. Finally, explore the two practical examples: LOESS Regression and K-Nearest Neighbors. Try adjusting the hyperparameters (smoothness and K) to see how they directly control the model's complexity and thus its position on the bias-variance spectrum.
The Mathematical Foundation of the Tradeoff
Your strong mathematical background will be an asset here as we formalize these ideas. The bias-variance decomposition provides a precise mathematical breakdown of the expected error. We will focus on the Mean Squared Error (MSE) for a regression problem, as it allows for a clean decomposition.
Professor Yaser Abu-Mostafa from Caltech provides one of the clearest derivations of this concept. His explanation hinges on the idea of an "average hypothesis," which is a conceptual tool to understand the model's behavior across many different training datasets.
Lecture 08 - Bias-Variance Tradeoff
This video from Caltech's "Learning from Data" course provides a rigorous, first-principles derivation of the bias-variance decomposition.
Please watch the segment from the start of the derivation. Pay close attention to these key steps: Defining the Goal: The objective is to decompose the expected out-of-sample error, \mathbb{E}_{\mathcal{D}}[\mathbb{E}_{x}[ (g^{(\mathcal{D})}(x) - f(x))^2 ]], where g^{(\mathcal{D})} is the hypothesis learned on a specific dataset \mathcal{D}. The Average Hypothesis, \bar{g}(x): This is introduced as \bar{g}(x) = \mathbb{E}_{\mathcal{D}}[g^{(\mathcal{D})}(x)]. It represents the average prediction the model would make at point x if it were trained on all possible datasets \mathcal{D} of a given size. The Decomposition: The core of the derivation is adding and subtracting \bar{g}(x) inside the squared term and expanding. You will see how the cross-term elegantly cancels out, leaving two distinct components.
Let's summarize the key mathematical result. If our true model is , where is noise with mean 0 and variance , then the expected prediction error of our learned model at a point is:
Let's break down each term:
- Bias²: The squared difference between the average prediction of our model (across all possible training sets) and the true function value. This measures how far off the model's average prediction is from the truth. A simple model, like a linear one trying to fit a curve, will have high bias.
- Variance: The variance of the model's predictions for a given point . This measures how much the model's prediction "jiggles" or varies as we use different training sets. A complex model that fits noise will have high variance.
- Irreducible Error (): The variance of the noise term . This is the lower bound of error that we can never overcome, regardless of the model we choose.
For a more condensed, text-based walkthrough of this derivation, you can refer to the following lecture notes.
STAT 479: Machine Learning Lecture Notes
These notes by Sebastian Raschka provide a concise, step-by-step algebraic derivation of the bias-variance decomposition for squared loss.
Please read section 8.4 Bias-Variance Decomposition of the Squared Loss (page 6). Focus on the algebraic manipulation in equations (5), (6), and (7) to see exactly how the total squared error, E[(y - \hat{y})^2], is broken down into [Bias]² + Variance.
Visualizing the Tradeoff with a Concrete Example
Theory is best understood through application. The Stanford Statistical Learning course provides excellent visualizations of the tradeoff using simulated data. The video shows how the test error curve is formed by the sum of the bias-squared and variance curves as model flexibility changes.
Statistical Learning: 2.3 Model Selection and Bias Variance Tradeoff
This video, featuring insights from statistics luminary Trevor Hastie, visually demonstrates the tradeoff with concrete examples.
Watch from the start of the examples. You will see: Three scenarios where the true underlying function has different levels of complexity. For each scenario, a plot shows the U-shaped Test MSE (red curve). Crucially, the plot also shows the underlying Bias² (blue curve, decreasing with complexity) and Variance (black curve, increasing with complexity) that sum to create the test error. This directly visualizes the tradeoff we derived mathematically.
The key insight is that as we make our model more flexible (e.g., use a higher-degree polynomial, a more complex spline, or a deeper decision tree), the bias consistently goes down because the model has more power to approximate the true function. However, the variance goes up because the model has more freedom to fit the random noise specific to the training set. Our goal is to find the "sweet spot" of complexity that minimizes their sum.

Implications for Generalization and Model Development
Understanding the bias-variance tradeoff has direct, practical implications for building models that generalize well. When you evaluate your model on the validation set and find that the error is high, you can use this framework to diagnose the problem and decide on a course of action.
-
If your model suffers from high bias (underfitting):
- Symptom: The model performs poorly on both the training set and the validation set. It's too simple to capture the underlying patterns.
- Remedies:
- Increase model complexity (e.g., switch from linear regression to a polynomial or a tree-based model).
- Engineer new features that might have a stronger relationship with the target.
- Reduce regularization, which penalizes complexity.
-
If your model suffers from high variance (overfitting):
- Symptom: The model performs extremely well on the training set but poorly on the validation set. It has memorized the training data, including its noise.
- Remedies:
- Decrease model complexity (e.g., use a simpler model, reduce the depth of a decision tree).
- Gather more training data. More data helps the model learn the true signal and ignore the noise.
- Increase regularization to penalize large model weights and discourage overly complex solutions.
This diagnostic process is a fundamental skill in applied machine learning. By analyzing your model's performance, you are essentially trying to locate where it sits on the U-shaped error curve and then taking steps to move it toward the minimum.
Conclusion
In this lesson, we have moved from simply measuring generalization error to understanding its constituent parts. The bias-variance tradeoff provides a theoretical lens through which we can analyze and improve our models.
Here are the essential takeaways:
- A model's expected error on unseen data can be decomposed into Bias², Variance, and Irreducible Error.
- Bias is a systematic error caused by a model's simplifying assumptions (leading to underfitting).
- Variance is an error caused by a model's excessive sensitivity to the training data (leading to overfitting).
- There is an inherent tradeoff: increasing model complexity typically reduces bias but increases variance. The goal of model selection is to find the optimal complexity that minimizes the total error.
- This framework provides a roadmap for model improvement: diagnosing high error as either a bias or variance problem suggests specific remedies.
We've now established what the problems of underfitting and overfitting are in terms of bias and variance. But how do we spot them in a real project? In our next lesson, we will learn how to diagnose these issues practically by plotting and interpreting learning curves, which show how training and validation errors change as the amount of training data increases.