Introduction
Welcome to your first lesson in the course on photosynthesis! Our goal throughout this course is to build a comprehensive understanding of how plants convert light energy into chemical energy, focusing on the physiological processes that govern this vital function.
We'll begin in this first module, "The Physics of Light Capture," by exploring the very first step of photosynthesis: how plants capture the energy from sunlight. Before any biochemistry can happen, the plant must effectively absorb light. This lesson focuses on our first learning outcome: to interpret an absorption spectrum of leaf pigments to identify which wavelengths are most effectively absorbed.
By the end of this lesson, you will be able to look at a graph showing light absorption by plant pigments and confidently determine which colors of light are the primary energy sources for photosynthesis. This fundamental skill will be the bedrock for understanding everything that follows.
The Nature of Light and Pigments
Photosynthesis is powered by light, but not all light is created equal. Light is a form of electromagnetic radiation, and the portion of the spectrum that plants use for photosynthesis is called Photosynthetically Active Radiation (PAR). This generally corresponds to the visible light spectrum, with wavelengths from approximately 400 to 700 nanometers (nm).
Plants capture this light energy using specialized molecules called pigments. As a chemistry graduate, you'll be familiar with the concept of colored compounds absorbing specific wavelengths of light while reflecting or transmitting others. Plant pigments, primarily chlorophyll, are the key to this initial energy capture.
To understand which wavelengths are most important, scientists measure the absorption spectrum of these pigments. An absorption spectrum is a graph plotting a pigment's light absorption versus the wavelength of light.
How is an Absorption Spectrum Measured?
The primary tool for this task is a spectrophotometer. This instrument measures the amount of light of a specific wavelength that is absorbed by a sample.
To see how this is done in practice for plant pigments, the following video demonstrates the process. It starts by using a simple colorimeter and then moves to a more advanced spectrometer to generate a full absorption spectrum from a spinach leaf extract.
This video from PASCO scientific will walk you through the experimental process of analyzing plant pigments. It provides a great visual for how the data for an absorption spectrum is collected.
Watch the entire video. Pay close attention to the shape of the final absorption spectrum generated by the spectrometer (starting around 5:10) and the conclusion drawn about which colors of light show the highest absorbance.
The video shows the result, but how is the experiment set up step-by-step? The document below is a lab protocol that details the procedure. You don't need to memorize the steps, but reading through it will give you a solid feel for the experimental basis of the graphs we will be interpreting.
Determining the Absorption Spectrum of Plant Pigments
This document from Texas Tech University provides a standard procedure for determining the absorption spectrum of pigments from a leaf.
Please read 'Part C: Testing Plant Extract' and the 'Instructions for Excel 2007 Version'. This will show you how absorbance is measured at discrete wavelengths and then plotted to create the spectrum.
Interpreting the Spectrum
Now that you have seen how an absorption spectrum is generated, let's focus on interpreting one.

Take a close look at the graph above.
- Identify the peaks: For both chlorophyll a and b, where do you see the highest absorbance? You should notice two main regions: a strong peak in the blue-violet range (approx. 400-450 nm) and another significant peak in the red range (approx. 650-700 nm).
- Identify the trough: Where is the absorbance lowest for the chlorophylls? This occurs in the green-yellow region of the spectrum (approx. 500-600 nm).
This pattern is the key takeaway. Photosynthetic pigments are most effective at absorbing light in the blue-violet and red parts of the spectrum.
Absorption vs. Action: What the Plant Actually Does with the Light
It's logical to assume that the wavelengths of light that are most absorbed are also the most effective at powering photosynthesis. We can test this by creating an action spectrum, which is a graph of the rate of photosynthesis versus wavelength.
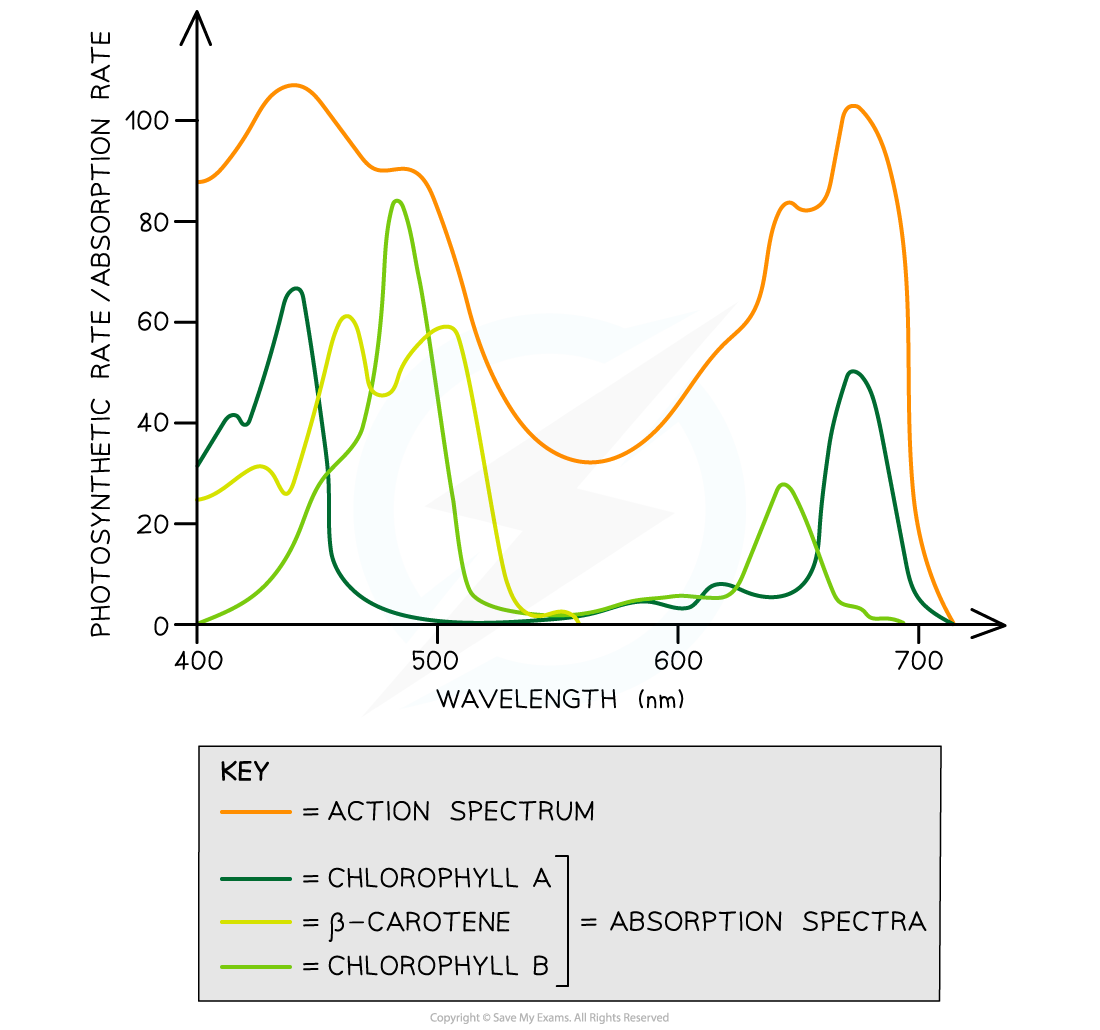
Notice how the shape of the action spectrum (the red line) closely matches the combined absorption spectra of the pigments. This confirms our interpretation: the peaks in absorption in the blue-violet and red regions correspond to peaks in photosynthetic activity.
The following video provides a concise summary of the relationship between these two types of spectra.
Photosynthesis Part 6 Action vs Absorption Spectrum IB Biology
This video from Alex Lee will help solidify the connection between the light that is absorbed (absorption spectrum) and the light that is used for photosynthesis (action spectrum).
Watch from 02:45 to 04:34. The video explains how the absorption spectrum of chlorophyll relates to the overall action spectrum of photosynthesis and introduces the idea of accessory pigments, which we will cover in a later lesson.
A Deeper Look: Interpreting Experimental Data
Your preference for analyzing experimental data will be well-served by looking at how these concepts are presented in scientific literature. The following resource is a research paper that investigates the photosynthetic physiology of different light colors.
Photosynthetic Physiology of Blue, Green, and Red Light - PMC
This research article, 'Photosynthetic Physiology of Blue, Green, and Red Light', provides real-world data on leaf absorptance. This allows us to move from a textbook diagram to the results of a specific experiment.
Please read the section 'Results > Leaf Absorptance'. Pay particular attention to Figure 2 (mentioned in the text) and the quantitative results describing the absorptance in the blue, green, and red regions for lettuce leaves.
In the section you just read, the researchers found that for lettuce leaves:
- Absorptance in the blue region (400-500 nm) was very high, averaging 91.6%.
- Absorptance in the red region had a peak at 666 nm of 92.6%.
- Absorptance was lowest in the green region, with a minimum of 69.8% at 551 nm.
These experimental values provide concrete evidence for the patterns we observed in the generalized absorption spectrum graphs. They empirically confirm that blue and red light are the most strongly absorbed wavelengths by a typical leaf.
Application: Thinking Like a Scientist
Let's apply what you've learned. The lab protocol you reviewed earlier includes a section with analytical questions. Use your understanding of absorption spectra to answer the following questions from that document.
- At which wavelengths does the extract from your leaf absorb the most light energy?
- Why does the extract absorb more light energy at some wavelengths and a lesser amount at others? Explain the pattern you see with wavelengths.
Based on everything we've covered, your answer to the first question should be the blue-violet and red wavelengths. For the second question, the pattern is explained by the molecular properties of the chlorophyll pigments, which are structured to efficiently absorb photons from these specific energy ranges, while being unable to absorb photons from the green range effectively.
Conclusion
In this lesson, we have taken the first step toward understanding photosynthesis by focusing on how plants capture light. You learned how to interpret an absorption spectrum and use it to identify the most effective wavelengths for photosynthesis.
Here are the key takeaways:
- An absorption spectrum is a graph that shows which wavelengths of light are absorbed by a pigment.
- It is measured experimentally using a spectrophotometer.
- Photosynthetic pigments, primarily chlorophylls, absorb light most strongly in the blue-violet (400-450 nm) and red (650-700 nm) regions of the visible spectrum.
- The rate of photosynthesis at different wavelengths (the action spectrum) closely matches the absorption spectrum, confirming that these absorbed wavelengths are the ones driving the process.
In our next lesson, we will build directly on this foundation. We will explore the question: If green light is absorbed so poorly, why do leaves appear green? We will also take a closer look at the different pigments involved and their specific roles in the grand task of harvesting light.