Hello! In our last lesson, we focused on the creative process of designing state diagrams, turning a problem description into a visual blueprint for a Finite State Machine (FSM). You learned to represent states, transitions, and outputs for both Mealy and Moore machines.
Today, we take the next logical step in the design process. We will translate those visual state diagrams into a structured, tabular format known as a state transition table. This is a crucial, mechanical step that formalizes the logic of your FSM, making it much easier to implement in hardware description languages like Verilog.
By the end of this lesson, you will be able to systematically convert any given state diagram into its corresponding state transition table, paving the way for coding your design.
1. From Diagram to Table: An Introduction
A state transition table serves the same purpose as a state diagram: it describes the behavior of an FSM. However, it presents the information in a format that is much closer to a truth table, which is ideal for implementation.
A state transition table has four main components:
- Present State: The state the machine is currently in.
- Input(s): The value(s) of the input signals at the current time.
- Next State: The state the machine will transition to on the next active clock edge.
- Output(s): The value(s) of the output signals.
The primary difference in how you construct the table for a Moore vs. a Mealy machine lies in how you determine the output. Let's watch a short video that explains this fundamental concept.
Finite State Machine Explained | Mealy Machine and Moore Machine | What is State Diagram ?
The video "Finite State Machine Explained" clearly defines the different ways FSMs can be represented, including state diagrams and state tables.
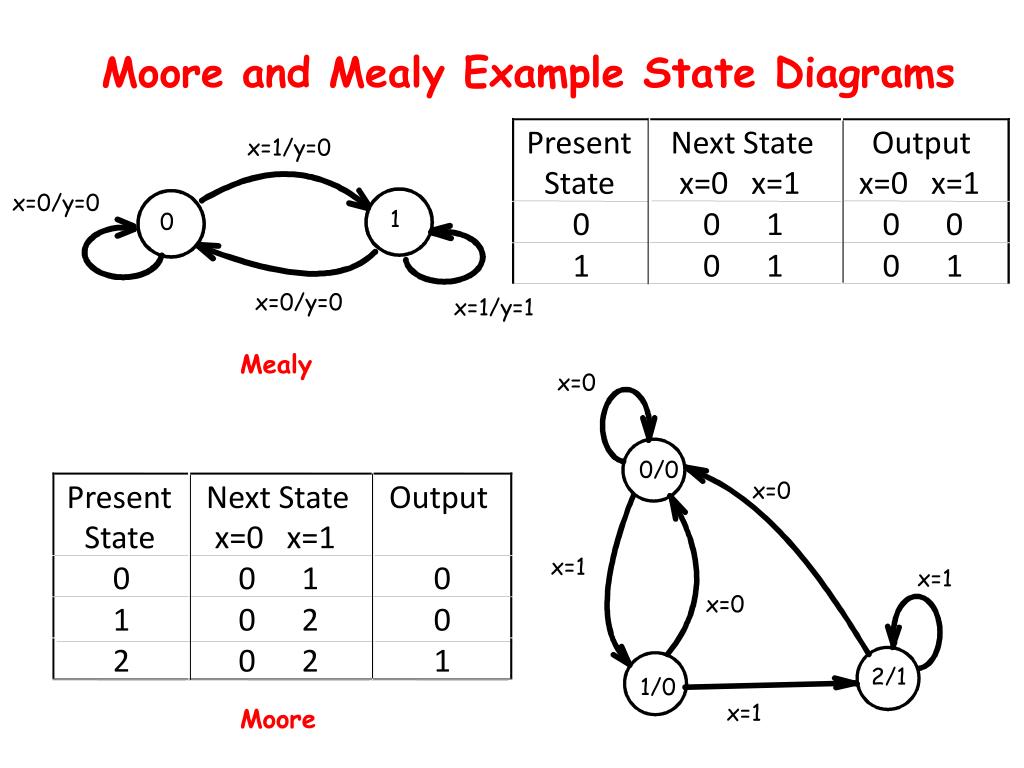
Watch from the beginning of the video until this point. The key things to focus on are: The three ways to represent an FSM: state diagram, state table, and state equations. We are focusing on the first two today. The structural difference between Mealy and Moore machines. The visual difference in their state diagrams, specifically where the output is written (inside the state circle for Moore, on the transition arrow for Mealy).
As the video explained, the state diagram is a pictorial representation, while the state table organizes the exact same information into a tabular format. The image below provides a great side-by-side comparison for both FSM types.
2. Translating a Moore FSM
Let's start with a Moore machine. Recall the 0111 sequence detector we designed in the previous lesson. The output y is 1 only when the machine is in the final state (S_0111), regardless of the input.
To create the state transition table, we follow these steps:
- Assign State Codes: Before we can create the table, we need a binary value for each state. Let's use a simple binary count for the five states of our Moore detector:
S_Idle=000S_0=001S_01=010S_011=011S_0111=100
- Set up the Table: Create columns for the present state, the input, the next state, and the output.
- Populate the Rows: For each present state, create a row for every possible input. Using the state diagram as your guide, fill in the "Next State" and "Output" for that combination.
Let's look at a clear, concise example of this process.
MIT Lecture Notes: Logic Derivation
This excerpt from an MIT lecture handout provides a perfect illustration of converting a state diagram into a state transition table.
Please read page 8 of the document. The key part is the table labeled "Current State, In, Next State, Out". Focus on how each row of the table directly corresponds to one of the transition arrows in the state diagram on the left. For example, find the row where Present State (S1 S0) is 00 and Input (L) is 1. Verify that the diagram shows a transition to state 01, matching the "Next State" column in the table.
As you can see, for a Moore machine, the output is strictly a function of the present state. In the table from the MIT notes, whenever the present state is 01, the output P is 1. For all other states, the output is 0.
3. Translating a Mealy FSM
Now, let's turn to the Mealy machine. The process is nearly identical, but with one critical difference: the output is determined by both the present state and the current input. This means the output is associated with the transition itself.
We can now watch the second half of the video from earlier, which demonstrates how to build the table for both machine types.
Finite State Machine Explained | Mealy Machine and Moore Machine | What is State Diagram ?
This part of the video walks through the step-by-step process of filling out a state transition table for both a Moore and a Mealy FSM.
Watch from this point. First, observe the construction of the Moore state table. Then, pay close attention to the Mealy state table construction. Notice how the narrator finds the output value on the transition arrow corresponding to the present state and the specific input.
The key takeaway is that in a Mealy state table, you can have two different output values for the same present state, because the output can change depending on the input.
4. Practice Exercise
Now it's your turn to practice. The image below shows a state diagram for a Mealy FSM and a partially completed state transition table. Your task is to fill in the missing rows for Present State C and Present State D.

Take a few minutes to trace the transitions from states C and D for inputs 0 and 1, and fill in the corresponding 'Next State' and 'Output' cells.
.
.
.
Solution:
Here is the completed table:
| Present State | Next State (Input=0) | Next State (Input=1) | Output (Input=0) | Output (Input=1) |
|---|---|---|---|---|
| A | A | B | 0 | 0 |
| B | C | B | 0 | 0 |
| C | A | D | 0 | 0 |
| D | C | B | 0 | 1 |
Let's verify the row for state D:
- If Input = 0: The diagram shows an arrow from D to C, labeled
0/0. So, the Next State is C and the Output is 0. - If Input = 1: The diagram shows an arrow from D to B, labeled
1/1. So, the Next State is B and the Output is 1.
Conclusion
In this lesson, we bridged the gap between the abstract, visual state diagram and a concrete, tabular format ready for implementation. This systematic translation is a vital skill in the digital design workflow.
Key Takeaways:
- A state transition table formalizes an FSM's behavior by listing the next state and output for every combination of present state and input.
- The translation process involves assigning binary codes to states and methodically filling out the table by tracing each transition on the state diagram.
- For a Moore machine, the output depends only on the present state.
- For a Mealy machine, the output depends on both the present state and the current input.
We are now perfectly positioned for the final step: implementation. In the next lesson, we will use a state transition table just like the ones we created today as a direct guide to write the Verilog code for a complete Moore FSM.