Hello! Welcome back to our course on mastering Notion for businesses.
In our last lesson, we focused on proactively designing for performance. You learned how to apply optimization strategies like self-filtering templates and contextual views to build fast, scalable systems from the ground up.
However, as a consultant, you will often be asked to improve existing systems that have already become slow and unwieldy. This requires a different skill: diagnostics. Today, we'll shift our focus from design to analysis. You'll learn how to step into a client's workspace, methodically investigate performance issues, and pinpoint the exact sources of slowness.
Our learning outcome for this lesson is to analyze a Notion system to identify performance bottlenecks in relations, rollups, and page structures.
From Architect to Archaeologist: Uncovering the Layers of Slowness
When a Notion workspace becomes slow, it's rarely due to a single cause. More often, it's an accumulation of architectural decisions that, while perhaps sensible for a small system, fail to scale. Your job is to act like an archaeologist, carefully uncovering the layers to find the foundational issues.
A great strategic overview of common architectural failures comes from Notion expert David Neira Muñiz. His insights provide a high-level map of what to look for.
Notion Database Architecture - David Neira Muñiz's Post
This post provides an excellent strategic framework by outlining the '3 deadly sins' of Notion architecture. Understanding these common traps will help you quickly categorize the problems you encounter in a client's workspace.
Please read the first half of this short post, down to the line 'Relations = where Notion's true power emerges.' Focus on the '3 deadly sins': the 'Everything Everywhere' trap, property proliferation, and the single mega-database. These are the high-level anti-patterns we'll be hunting for.
These "sins" are the symptoms. Now, let's look at the technical "pathogens" that cause them. Performance degradation in Notion almost always traces back to making the system work too hard to calculate and display information.
The Anatomy of a Bottleneck
A bottleneck occurs when Notion is forced to perform too many computations or load too much data just to render a page or view. Let's break down the most common culprits.
1. Overly Complex Reference Chains (Rollups & Formulas)
This is, by far, the most significant cause of performance issues in complex Notion systems.
- What they are: A reference chain is how Notion pulls data from one database into another. A
Relationis the first link. ARollupthat pulls data through that relation is the second link. AFormulathat references that rollup is a third link. - Why they are slow: Rollups and formulas are not static data; they are calculated on the fly every time a view is loaded. The longer and more complex the chain of calculations, the slower the load time.
The most notorious example is the "rollup of a rollup." While Notion blocks this directly, users often create a workaround by having Database C roll up data from Database B, which in turn has a formula property that references a rollup from Database A. This creates a "rollup cascade" that is extremely taxing on performance.
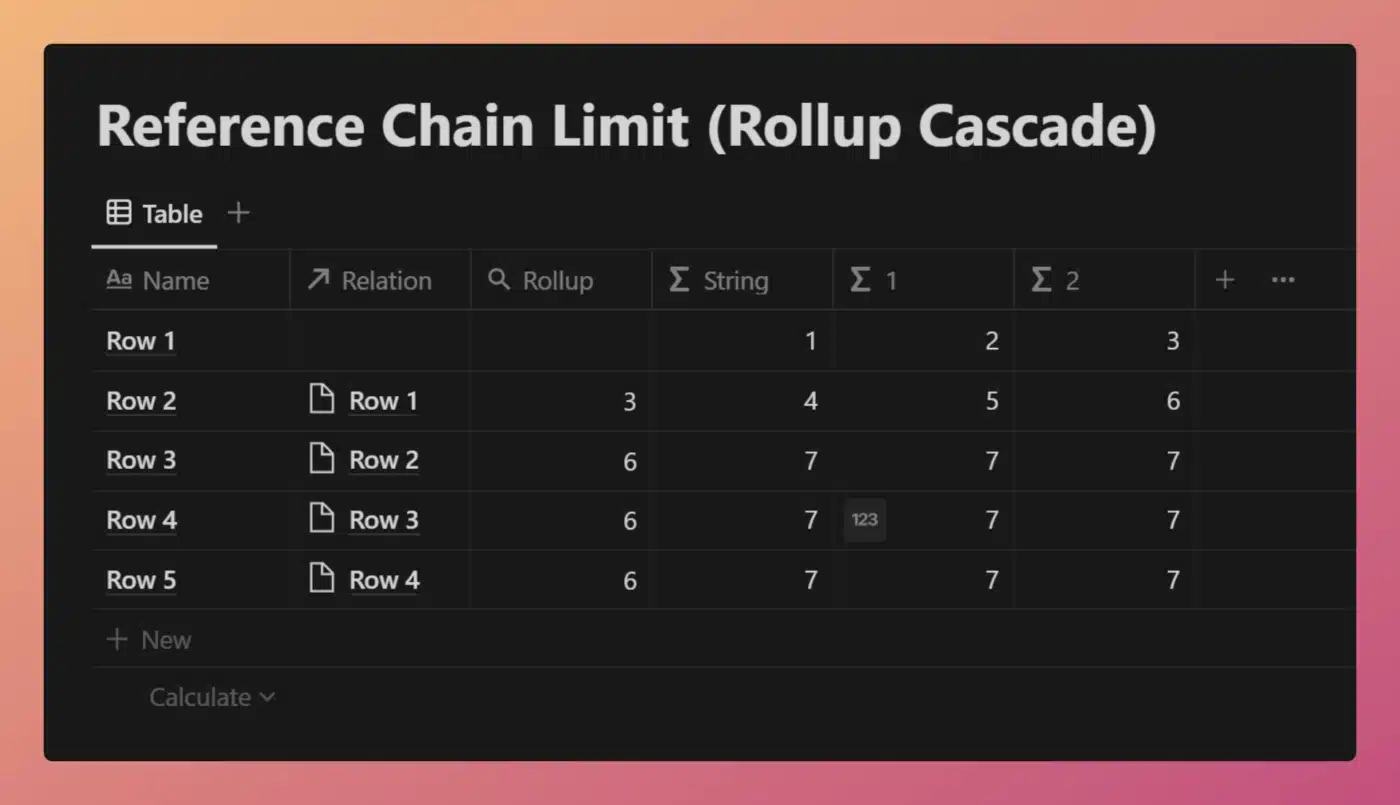
The official Notion documentation and expert advice both strongly warn against this.
Optimize database load times & performance
Let's review Notion's official guidance on this topic, and see how it aligns with advice from the field.
In this article, please read the sections titled 'Avoid complex reference chains' and 'Minimize the number of filters and sorts on formulas and rollups'.
As you can see, filtering or sorting by a Rollup or Formula property is particularly slow because Notion must first compute the value for every single item in the database before it can apply the filter or sort.
2. Bloated Page Structures
The second major area for bottlenecks is not within a database, but on the pages where databases are displayed, especially dashboards.
The problem is simple: loading too much at once. A common mistake is to create a "master dashboard" that contains multiple full, inline, or embedded databases. When a user opens this page, Notion tries to load all of that data simultaneously.
The key points to check on any given page are:
- Number of Databases: How many linked or inline databases are on this page?
- Configuration: Are they separate linked databases, or are they different
viewswithin a single linked database block? Using tabs (views) is far more performant, as only the active tab's data is loaded initially.
3. Database Size and Limits
Finally, the sheer size of a database can be the issue. While Notion is powerful, it has physical limits. Understanding these limits is crucial because hitting them is a definitive sign that a system's architecture is not scalable.
Optimize database load times & performance
Notion's documentation details the specific size limits for databases. Knowing these numbers can help you identify when a client's system is approaching a critical failure point.
Please read the entire 'Database size limits' section. Pay close attention to the distinction between the page-level limit (data within a single row's properties) and the database-level limit (the overall structure of properties).
If you see the warning banners mentioned in that article, it's a red alert. It tells you the problem isn't just about a slow view; the fundamental data structure is overloaded. The 10,000 reference limit on two-way relations is also a critical indicator of a system that may be using relations improperly (e.g., relating everything to a single central page).
A Framework for Performance Audits
When analyzing a client's system, a structured approach is essential. Here is a step-by-step framework to guide your analysis:
Phase 1: Triage & User Feedback
- Interview the Users: Don't start by digging into databases. Ask the client: "Which pages feel slow? What specific actions are laggy?" This focuses your investigation immediately.
- Identify High-Traffic Pages: The slowest parts of a system are almost always the most-used pages, like team dashboards or project hubs. Start your analysis there.
Phase 2: Page-Level Analysis
- Count the Databases: On a slow page, count how many separate linked/inline database blocks exist. If it's more than a few, this is a likely culprit.
- Check for Filters: Look at each database view. Are they filtered? A view showing thousands of unfiltered items is a major red flag.
- Check View Configuration: Are multiple databases presented as separate blocks, or as tabs within a single block? The former is much less performant.
Phase 3: Database-Level Analysis
- Examine Rollups: This is your primary target. Open the database settings (
...->Properties). Look forRollupproperties. For each one, check:- What relation is it using?
- What property is it calculating?
- Is that property another rollup or a complex formula? (This is the cascade!)
- Examine Relations: Are the relations clear and purposeful (e.g.,
Projects<->Tasks)? Or do you see a mess of relations connecting everything to everything (the "Everything Everywhere" trap)? - Check View Filters & Sorts: Open the filter and sort menus for the most-used views. Are they filtering/sorting based on
RolluporFormulaproperties? This is a huge performance hit. A filter on aStatusorSelectproperty is much faster.
Test your understanding!
A client tells you their "Quarterly Goals" dashboard is unusably slow. The dashboard shows a list of all company projects for the quarter. Each project in the list displays a "Progress %" bar.
Based on the audit framework, what is the very first thing you would investigate to find the source of the slowness, and why?
Show answer
The first thing to investigate is the "Progress %" rollup property.
Why: A percentage bar like this is almost certainly a Rollup property on the Projects database. It likely calculates the percentage of completed tasks by rolling up data from a related Tasks database.
This single property forces Notion to:
- Access the
Projectsdatabase. - For every project, traverse the relation to the
Tasksdatabase. - Count all related tasks and the subset of completed tasks.
- Perform a division to calculate the percentage.
- Render this calculation for every single project shown in the view.
This is a classic example of a complex calculation causing a performance bottleneck.
Conclusion
You now have a systematic framework for dissecting a Notion system and identifying the root causes of poor performance. This analytical skill is what separates a basic Notion user from a strategic consultant.
Key Takeaways:
- Performance analysis is a diagnostic process that starts with user feedback and drills down into the technical details.
- The most common and severe performance bottlenecks are caused by complex reference chains, particularly "rollup cascades" and views that filter or sort on calculated properties.
- Bloated page structures, such as dashboards with too many unfiltered and simultaneously loaded databases, are another major cause of slowness.
- Notion's hard database size limits serve as critical warning signs that a system's architecture is fundamentally flawed and needs rethinking.
In our next lesson, we will address the "so what?" question. Now that you can find these bottlenecks, what do you do about them? We will implement optimization patterns such as "lazy loading" with linked databases and view-based template design to actively fix the problems you've learned to identify today.