Hello! Welcome back to our module on designing core business systems in Notion.
In our last lesson, you built the structural bridge connecting your CRM entities (Companies, Contacts) to your Project Management system (Projects, Tasks). By implementing these relationship mappings, you've created an integrated data environment. The question now is: how do we leverage this to get meaningful insights?
Today, we'll answer that question. Your learning outcome is to create automated reporting views that surface key client metrics and relationship health indicators. This is where your system transforms from a data repository into a dynamic business intelligence tool. We'll explore how to architect views that don't just show data, but tell a story about your sales pipeline, client engagement, and overall business health.
1. From Data to Decisions: The Goal of Reporting
Before we dive into the "how," let's clarify the "why." As a process improvement expert, you know that data is only useful if it drives action. An effective CRM reporting system should allow a business owner to answer critical questions at a glance:
- What does our sales pipeline look like?
- Which clients are our most valuable?
- Which relationships are at risk of going cold?
- How is the sales team performing against targets?
We will now build the components to answer these questions directly within Notion.
2. The Foundation: Reporting with Filtered Views
The simplest form of reporting in Notion is creating dedicated, filtered views of your core databases. Instead of one massive list of all opportunities, you can create specific "lenses" to see different segments of your data.
How to Build a Notion CRM Like Salesforce (Free Template)
The video 'How to Build a Notion CRM Like Salesforce' provides a great example of this principle. The creator explains how different database views can act as simple, effective reports, similar to what you'd find in a dedicated CRM like Salesforce.
Watch from 10:03 to 11:09. Focus on the examples given, such as separate views for 'prospects', 'customers', 'open opportunities', and 'opportunities won this month'. This demonstrates how filtering is the first step in creating reporting views.
This is the baseline for any reporting dashboard. By creating views for "Open Deals," "Deals Won this Quarter," or "Prospects," you are already creating a rudimentary reporting system that provides immediate value and clarity.
3. Calculating Key Metrics with Rollups
Filtered views show you lists of items, but to get true "metrics," you need to perform calculations. This is where the Rollup property becomes essential. A rollup pulls data from related pages and calculates a value, such as a sum, an average, or a date.
In the last lesson, you connected Companies to Projects and Opportunities. Now, let's use rollups to pull key information across those connections.
Build a Notion CRM Template in Under an Hour
To move from simple lists to calculated metrics, we need to master Rollups. This article from Notion Sender, 'Build a Notion CRM Template in Under an Hour,' provides an excellent guide on how to create these automated insights.
Read the sections 'Automating Insights with Rollups' and 'Real-World Rollup Scenarios'. Pay close attention to the step-by-step process for creating a 'Total Deal Value' rollup and the conceptual examples for 'Last Interaction Date' and 'Total Interactions Count'.
Here's how you can architect some key indicators using this technique:
- Key Client Metric: Total Client Value: In your
Companiesdatabase, create aRollupthat targets theOpportunitiesrelation. Have it pull the "Value" property andSumthe results. This gives you an instant lifetime value for each client. - Relationship Health Indicator: Last Contact Date: In your
Companiesdatabase, create anotherRollupthat targets yourInteractionsrelation. Have it pull the "Date" property and show theLatest date. This immediately tells you which client relationships might be going cold.

Test your understanding!
You want to create a "Relationship Health Score" for each Company. You decide that a key factor is how many interactions (meetings, calls) you've had with them in the last 90 days.
From a high level, how would you architect this using the tools we've discussed so far? (No need for formulas).
Show answer
- Filter the source: In your
Interactionsdatabase, you would first need aFormulaproperty (or a manual check) to determine if an interaction occurred in the "Last 90 Days." Let's call this propertyIs Recent. Since you prefer using AI for formulas, you'd ask it to generate a formula that returnstrueif the interaction date is within the last 90 days. - Create the Rollup: In the
Companiesdatabase, you would create aRollupproperty. - Configure the Rollup:
- Relation:
Interactions - Property:
Is Recent - Calculate:
Count per group->Checked. This will count every linked interaction where theIs Recentcheckbox is ticked.
- Relation:
This gives you a number for recent interactions, a powerful health indicator.
4. Assembling Your Reporting Dashboard
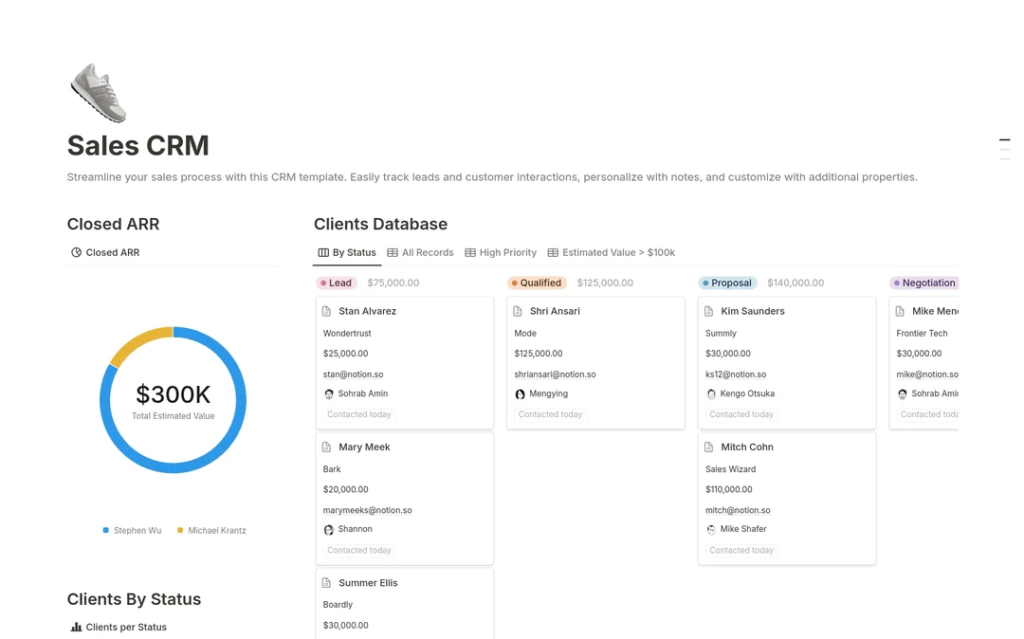
Having metrics inside your databases is great, but a true reporting view consolidates the most important information onto a single page—a dashboard or "command center." The best way to build this is with Linked Views of a Database.
Build a Notion CRM Template in Under an Hour
Once you have your metrics, you need a place to display them. This next part of the same article explains how to build a dynamic dashboard using linked views.
Now read the sections 'The Magic of Linked Views for a Dynamic Hub' and 'Building Your Action-Oriented Views'. Focus on the strategy of using filtered, linked views to create a 'command center' that answers specific business questions like 'Which leads are going cold?' or 'What deals are active?'
Your dashboard page becomes the central hub. On it, you could have:
- A linked view of
Opportunitiesfiltered for "Stage is not Closed Won/Lost" and grouped by stage in a Board view to show your active pipeline. - A linked view of
Companiesfiltered for "Last Contact Date is before 30 days ago" in a List view, creating a "Clients to re-engage" action list. - A linked view of
Opportunitiesfiltered for "Close Date is This Month" and showing theSumof the "Value" property to display a "Monthly Forecast."
5. Visualizing Data with Native Charts
For an even more powerful at-a-glance understanding, you can visualize your metrics using Notion's built-in charts. Think of charts as just another type of database view, like a Table or Board.
Use charts to visualize data and track progress directly in ...
For a more visual representation of your data, Notion's built-in charts are a powerful tool. This official guide from Notion explains the fundamentals.
Read the sections 'How your database becomes a chart' and 'Combine charts to create a dashboard'. Understand the different chart types (donut, bar, line) and how they can be used to visualize data from your CRM databases.
Applying this to your CRM, you could add several charts to your dashboard:
- A Donut Chart of your
Opportunitiesdatabase, with the values segmented by "Stage," to visualize your sales pipeline distribution. - A Bar Chart of
Opportunitiesshowing theSumof "Value" and grouped by "Sales Rep" to track team performance. - A Line Chart of
Opportunitiesshowing theCountof deals with aGroup byof "Closed Date" (by Month) to visualize sales trends over time.
Conclusion
In this lesson, you've learned to architect the reporting layer of your Notion business system. You've moved from simply storing data to creating views that generate actionable intelligence. This is the hallmark of a truly scalable and strategic system.
Key Takeaways:
- Reporting is about answering questions: A good reporting view is designed to provide clear answers to specific business questions.
- Filtered Views are the foundation: They allow you to segment your data into meaningful lists (e.g., Prospects, Customers).
- Rollups calculate key metrics: They are essential for turning raw data into quantitative metrics like "Total Client Value" and health indicators like "Last Interaction Date."
- Dashboards consolidate information: Use a dedicated page with linked views and charts to create a central "command center" for your CRM.
- Charts provide visual insight: Use Notion's native charts to visualize trends and distributions for quick, intuitive understanding.
In our next lesson, we will focus on standardizing your delivery process. Now that you understand how to report on client and project data, you'll be well-equipped to design a master project template incorporating standardized phases and tasks, ensuring you capture the right data from the very start of every new project.