Hello and welcome back. In our previous lessons, we've focused on how a Java program gets from source code to executable bytecode and how the JVM's class loaders dynamically bring that code into the running virtual machine. Now that we have the classes loaded, the natural next question is: where does the JVM put all this information, and how does it manage the memory needed to execute the program?
This lesson will answer that question by exploring the JVM Runtime Data Areas. You will learn to describe the five fundamental memory regions that the JVM creates and manages during program execution. Understanding this internal architecture is not just academic; it's essential for diagnosing performance issues, debugging memory errors, and writing efficient, robust Java applications—skills that are foundational for any backend engineering role.
We will cover:
- Heap: The main memory pool for objects.
- JVM Stack: The area for tracking method calls and local variables.
- Method Area: The storage for class metadata.
- PC Register: The pointer that tracks the current instruction.
- Native Method Stack: The stack for non-Java (native) code.
Let's begin by getting a comprehensive overview of these areas.
This article from Baeldung provides a concise and well-structured introduction to each of the five runtime data areas. It's an excellent starting point for mapping out the JVM's memory landscape.
Please read the entire article, paying close attention to the distinction made between Shared Data Areas (Section 2) and Per-thread Data Areas (Section 3). For each of the five areas, focus on its primary purpose and lifecycle.
A Map of JVM Memory
The reading you just completed introduced a crucial distinction: some memory areas are shared among all threads, while others are private to each individual thread. This separation is fundamental to how the JVM enables concurrency while maintaining thread safety.
- Shared Areas (Heap, Method Area): Created once when the JVM starts. All threads can access this memory, which means access to the data here (like object fields) must often be synchronized to prevent race conditions.
- Per-Thread Areas (JVM Stack, PC Register, Native Method Stack): Created for each new thread and destroyed when the thread terminates. This data is inherently thread-safe as it's never shared.
Here is a common visualization of this architecture:
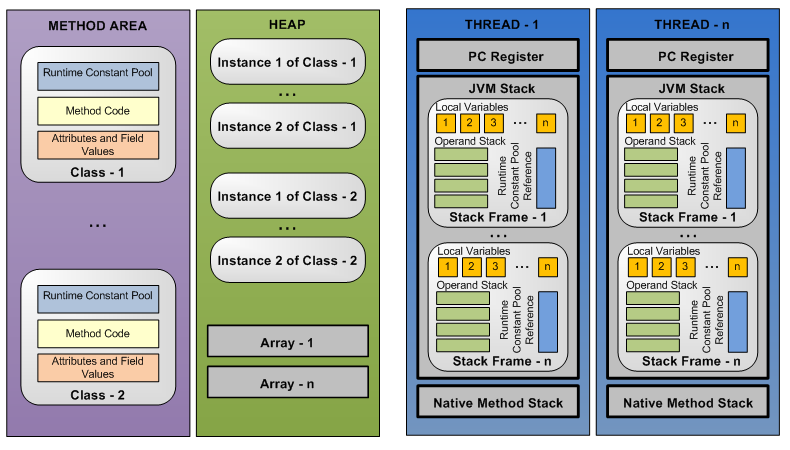
Now, let's explore each of these areas in more detail.
Shared Data Areas
1. Method Area
The Method Area is where the JVM stores the definitions of the classes that have been loaded. Think of it as the JVM's internal library of blueprints. For every class loaded by a class loader (as we saw in the previous lessons), the JVM stores its structural information here.
Java Memory Management Explained
This section from DigitalOcean's guide provides an excellent explanation of the Method Area, and crucially, its modern implementation. It details the evolution from the problematic "Permanent Generation" (PermGen) to "Metaspace".
Please read the section titled "Method Area...". Focus on understanding: What specific class-level information is stored here (e.g., method code, field names). The key differences between the pre-Java 8 PermGen and the current Metaspace implementation, especially regarding memory location (heap vs. native memory) and size limitations.
As you read, the most significant takeaway is the shift to Metaspace. Before Java 8, this class metadata was stored in a fixed-size part of the heap called PermGen, which frequently caused java.lang.OutOfMemoryError: PermGen space in applications that loaded many classes, such as web servers. By moving this data to native memory with Metaspace, the JVM can allow it to grow more dynamically, alleviating a major pain point for developers. However, it's not a silver bullet; a class loader leak can still exhaust native memory, leading to an OutOfMemoryError: Metaspace.
2. Heap
The Heap is arguably the most famous part of JVM memory. It is the runtime data area from which memory for all class instances and arrays is allocated. When you write new MyObject(), the memory for that object is carved out of the heap.
Key characteristics of the heap include:
- It's a shared resource, accessible by all threads.
- Its lifetime is tied to the JVM itself—created at startup, destroyed at shutdown.
- It is the only memory area managed by the Garbage Collector (GC). The GC's entire job is to automatically find and reclaim memory in the heap that is no longer being used by the application.
- If the heap becomes full and the GC cannot free up enough space for a new allocation, the JVM will throw a
java.lang.OutOfMemoryError: Java heap space.
We will dedicate an entire future module to the heap's internal organization (Young and Old generations) and the garbage collection process, as they are critical topics for performance tuning.
Per-Thread Data Areas
3. JVM Stack
While objects live on the heap, the flow of execution is managed on the JVM Stack. Every time a thread is created, it gets its own private JVM Stack. This stack stores frames. A new frame is created and pushed onto the stack each time a method is invoked, and it's popped off when the method completes (either by returning or by throwing an exception).
Because each thread has its own stack, no synchronization is needed for stack access. This makes method invocation and local variable access extremely fast.
A common point of confusion is the relationship between the Stack and the Heap. Let's clarify this with a practical demonstration.
Java Memory Management Deep Dive | How Java Handles Memory Internally
This video from "The Curious Coder" provides a clear, code-driven explanation of how the heap and stack work together during object creation and method execution.
Please watch the segment from object creation. The presenter creates two Employee objects and explains precisely which information goes onto the stack (the reference variables e1, e2) and which goes into the heap (the actual Employee objects with their instance variables).
To summarize the video's excellent point:
- The stack stores primitive local variables (like
int,double,boolean) directly. - The stack stores references (memory addresses) to objects.
- The objects themselves, with all their instance variables, always reside on the heap.
If a thread's method calls are nested too deeply (e.g., an infinite recursion), the stack will run out of space for new frames, and the JVM will throw a java.lang.StackOverflowError. Given your familiarity with data structures, you can see this is the direct result of exhausting the memory allocated for the call stack data structure.
4. PC Register
The Program Counter (PC) Register is the simplest of the data areas. Each thread has its own PC Register. It contains the address of the Java Virtual Machine instruction currently being executed.
Think of it as a bookmark for each thread. Because the operating system may switch between threads thousands of times per second, the JVM needs to know exactly where to resume execution for each thread. The PC register provides this "bookmark."
If the thread is executing a native method (which we'll see next), the value of the PC register is undefined, as the execution is now being managed outside the JVM.
5. Native Method Stack
Java provides the ability to call methods written in other languages, such as C or C++. These are called native methods and are declared with the native keyword. A prime example is Object.hashCode() in some JDK implementations.
When a thread invokes a native method, it doesn't use the JVM Stack. Instead, it uses a Native Method Stack. This stack works similarly to the JVM stack but is tailored to the conventions of the underlying native C/C++ runtime. It stores local variables and other information needed for the native code's execution.
Like the JVM Stack, each thread gets its own Native Method Stack. If a JVM implementation doesn't support native methods, it doesn't need to provide a native method stack.
Conclusion
In this lesson, we have mapped out the entire memory landscape of a running Java Virtual Machine. You can now describe the five core runtime data areas and, crucially, understand their distinct roles and lifecycles.
Key Takeaways:
- The JVM memory is divided into five areas: Heap, Method Area, JVM Stack, PC Register, and Native Method Stack.
- These areas are separated into two categories: shared among all threads (Heap, Method Area) and private to each thread (JVM Stack, PC Register, Native Method Stack).
- Method Area (Metaspace) stores class definitions and metadata.
- Heap stores all objects and arrays created with
new. It is managed by the Garbage Collector. - JVM Stack tracks method invocations via stack frames, holding local variables and object references.
- PC Register acts as a per-thread instruction pointer.
- Native Method Stack supports the execution of non-Java code.
We've established where data lives. In our next lesson, we will zoom in on the JVM Stack to dissect the internal structure of a single stack frame, exploring the local variable array, the operand stack, and frame data to see exactly how the JVM executes bytecode instructions.