Hello! Welcome back to our journey into the internals of the Java Virtual Machine.
In our previous lesson, we explored how the JVM uses generational garbage collection to efficiently manage memory, focusing its efforts on the Young Generation where most objects die. We concluded by noting that while Minor GCs are fast, collection events in the Old Generation—often called Major or Full GCs—can be costly. This cost is not just in CPU cycles, but in application responsiveness. Today, we will confront that cost head-on.
This lesson unpacks the concepts of stop-the-world pauses and safepoints. You will learn why the JVM must periodically halt all application threads, how it accomplishes this through a cooperative mechanism, and how these pauses—both the visible and the hidden—are the single biggest factor influencing application latency.
The Inescapable Pause: Stop-the-World
Garbage collection involves traversing the object graph and, in many cases, moving objects in memory (e.g., copying survivors or compacting the heap). Imagine trying to perform this delicate operation while the application is simultaneously creating new objects and changing references between existing ones. The state of the heap would be in constant flux, making it impossible for the GC to get a consistent picture.
To solve this, the JVM enforces a "stop-the-world" (STW) pause. During an STW pause, all active application threads (often called "mutator" threads because they mutate the application's state) are completely suspended. Only the JVM's own threads, like the GC threads, are allowed to run. This gives the GC exclusive and safe access to the heap.
The following short video segment explains this fundamental trade-off in the context of the generational garbage collection we discussed previously.
Understanding the JVM and Low Latency Applications
This clip from the "Understanding the JVM and Low Latency Applications" presentation on the official Java YouTube channel clearly explains why pauses are necessary during garbage collection.
Watch the segment from this explanation, which details why the JVM must pause mutator threads to safely copy objects during a GC cycle and how this non-deterministic event impacts latency.
Safepoints: The Cooperative Path to a Standstill
The term "stop-the-world" might conjure an image of the JVM abruptly freezing every thread in its tracks. The reality is more nuanced and relies on a cooperative mechanism built around safepoints.
A safepoint is a specific point in a thread's execution where its state is well-defined and known to the JVM. Crucially, at a safepoint, the thread's view of the object graph is consistent, and all its local GC roots (references on its stack and in CPU registers) can be accurately located.
When the JVM needs to initiate an STW pause, it doesn't force-stop threads. Instead, it signals a global request for all threads to proceed to their next safepoint and park themselves. The STW operation (like a GC) can only begin once every single application thread has reached a safepoint and stopped.
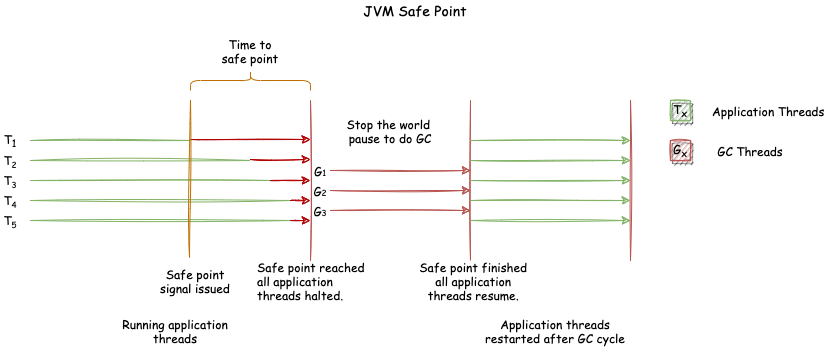
Garbage collection is the most common reason for a safepoint, but it's not the only one. Many other internal JVM operations require a globally consistent state.
JDK Flight Recorder vs. Stop the World Pauses
This article from BellSoft provides a clear definition of STW pauses and safepoints from the perspective of the HotSpot JVM.
Please read the introduction and the section "Stop-the-World in HotSpot JVM." Focus on the formal definition of a safepoint and the list of operations that trigger them.
How Threads Find Their Safepoint
For this cooperative system to work, threads must check for safepoint requests periodically. If they didn't, a thread stuck in a long computational loop could delay an important STW operation indefinitely.
To prevent this, the JIT compiler inserts safepoint poll instructions into the compiled code at strategic locations. These are typically:
- On the back-edge of loops (to ensure long-running loops don't block the JVM).
- Before method returns.
- At method call sites.
A safepoint poll is a very low-overhead check. A common implementation involves reading from a specific memory page. In normal operation, this read is trivial. However, when the JVM wants to trigger a safepoint, it uses virtual memory tricks to change the protection on that page to "no access." The next time any thread attempts to poll that page, it triggers a hardware trap (an access violation). This trap is caught by a special signal handler within the JVM, which knows this is not a crash but a safepoint request. The handler then takes over, pauses the thread, and waits for the STW operation to complete.
Given your background in systems and low-level programming, you may find the precise mechanics of this process fascinating. The following clips from a deep-dive presentation by a HotSpot VM engineer walk through this mechanism in detail, right down to the assembly level.
HotSpot JVM Deep Dive - Safepoint
This video, "HotSpot JVM Deep Dive - Safepoint," offers an expert look at the implementation. We will watch three key segments.
First, watch the overview of cooperative suspension, which explains the polling technique and why safepoints are a primary source of latency. Next, see how the JIT compiler inserts poll instructions into the code, with a clear assembly example. Finally, and most importantly, watch the explanation of the poll page mechanism. This covers how an access violation is intentionally used to trap a thread and redirect its execution to pause it.
The Hidden Cost: Time-to-Safepoint (TTSP)
The total pause time an application experiences isn't just the time spent performing the VM operation itself (e.g., the GC work). It's the sum of two components:
- Time-to-Safepoint (TTSP): The time from when the JVM requests a safepoint until the last application thread reaches one.
- VM Operation Time: The time spent actually performing the work, like garbage collection or a thread dump.
For a long time, the focus of GC tuning was on reducing the VM operation time. However, as modern collectors like ZGC have reduced GC pauses to under a millisecond, the focus has shifted to the often-overlooked TTSP. A long TTSP can easily cause multi-second application pauses, even if the GC itself is incredibly fast.
JVM Garbage Collection Guide: Collectors, Tuning, and Selection | Michał Artur Marciniak
This comprehensive guide to JVM garbage collectors has an excellent section dedicated to the problem of safepoint latency.
Read the section "Safepoints - The Hidden Pause Driver." It provides a concise explanation of what causes long TTSP, its real-world impact, and how these issues can be diagnosed and fixed at the application level.
As you've just read, long TTSP issues are often caused by application behavior that prevents threads from polling in a timely manner—like tight loops on large arrays or long-running native code. This demonstrates a crucial point: application latency is a product of both the JVM's behavior and your own code's structure.
Visualizing the Impact
The difference in pause-time behavior between older, throughput-focused collectors and modern, low-latency collectors is stark. The following illustrative flame graphs compare a legacy collector (like CMS or G1 in a bad state) with ZGC.
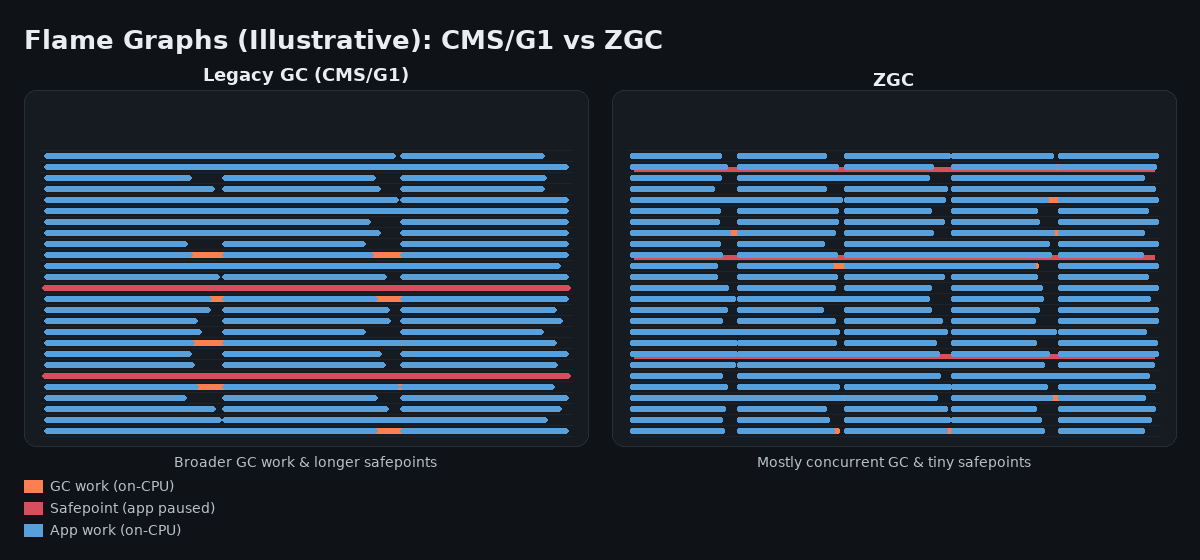
On the left, you see the profile of a collector that requires longer STW pauses (the wide red bands). The application is completely frozen during these periods. On the right, ZGC performs most of its work concurrently (the orange blocks), and the required STW pauses are just tiny red slivers. For applications using ZGC, the dominant factor for any significant pause is far more likely to be Time-to-Safepoint rather than the GC work itself.
Conclusion
In this lesson, we've pulled back the curtain on one of the most critical aspects of JVM performance. You now have a deep understanding of why and how the JVM pauses your application.
Key Takeaways:
- Stop-the-World (STW) pauses are necessary for the JVM to perform operations like GC that require a stable, consistent view of the heap.
- STW is achieved through safepoints, which rely on a cooperative suspension mechanism where threads periodically poll for a stop request.
- The JIT compiler inserts safepoint polls at strategic locations (like loop back-edges) to ensure threads check in regularly.
- Application latency is a function of both the time spent at the safepoint (doing the VM operation) and the Time-to-Safepoint (TTSP) (waiting for threads to stop).
- Modern low-latency GCs dramatically reduce the time spent at the safepoint, making TTSP a critical, and often dominant, source of latency in highly-tuned applications.
We've seen how the design of different garbage collectors is fundamentally about managing these pauses. This provides the perfect foundation for our next lesson, where we will formally compare the most common GC algorithms—from the simple Serial collector to the complex ZGC—and analyze the specific trade-offs each one makes between throughput, latency, and memory footprint.