Welcome to the final lesson in our first module on the foundations of medical research. In our last session, you learned to identify the four major study designs: cross-sectional, case-control, cohort, and the randomized controlled trial (RCT). You now understand the blueprint of a study and its position in the hierarchy of evidence.
Today, we connect that blueprint to the statistical tools you will use. This lesson is the crucial bridge between study design and data analysis. You will learn how the choice of a study design—the very structure of the research—directly dictates the appropriate statistical test. This is the "why" that precedes the "how-to" of running analyses in SPSS. Mastering this logic is what separates a technician from a true biostatistician.
From Research Question to Statistical Test
The central principle is this: your study design is chosen to answer a specific research question. That design determines what kind of data you collect and how it's structured. In turn, the research question and the nature of the data determine the correct statistical test.
To select the right test, you must answer a few key questions about the study. A great overview of these guiding questions is presented in the article "An Introduction to Statistics: Choosing the Correct Statistical Test".
Choosing the Correct Statistical Test - PMC
This article from the Indian Journal of Critical Care Medicine provides a concise framework for test selection, which we will build upon throughout this lesson.
Please read the following short sections: The first question concerns your research goal: are you describing, comparing, or looking for an association? The second question addresses the data structure, which is directly determined by your study design. The third question relates to the variable types (categorical/numerical), which you learned to classify in a previous lesson. The final key question is about the number of groups or measurements involved.
These questions form a decision-making framework. Let's explore the most critical ones in more detail.
1. What is the Goal: Comparison or Relationship?
As the article mentions, the primary goal of your analysis can usually be boiled down to one of two objectives:
- Comparing Groups: You want to see if there is a difference in an outcome between two or more distinct groups. For example, does a new drug lower cholesterol more than a placebo? This is the typical goal of an RCT.
- Assessing a Relationship (Association/Correlation): You want to see how two variables move together. For example, as age increases, does blood pressure also tend to increase? This is often the goal of an observational study.
This distinction is the first major branching point in selecting a test. The video below clearly illustrates this choice.
How to choose an appropriate statistical test
This video from TileStats provides a clear visual breakdown of the test selection process.
Watch the first segment from the introduction, which contrasts the goal of comparing differences with the goal of investigating relationships.
2. Are the Data Paired or Unpaired?
This is where your knowledge of study designs becomes critical.
- Unpaired (Independent) Data: The measurements are taken on different, unrelated individuals.
- Example: In an RCT comparing a drug group to a placebo group, the patients in each group are independent.
- Example: In a case-control study, the cases are one group and the controls are another. They are independent.
- Paired (Dependent/Related) Data: The measurements are related. This often occurs in two scenarios:
- Repeated measurements: The same variable is measured multiple times on the same subject, such as before and after an intervention. This is common in pre-post studies.
- Matched subjects: Participants in different groups are deliberately matched based on key characteristics (like age and sex). This is sometimes done in case-control studies to create more comparable groups.
The video below provides excellent examples to help you distinguish between these two data structures.
How to choose an appropriate statistical test
The same TileStats video gives a fantastic explanation of paired versus unpaired study designs.
Watch the section from that explains this concept, paying close attention to the examples of independent groups, matched pairs, and before-and-after studies.
The choice between an unpaired test (like an independent t-test) and a paired test (like a paired t-test) is entirely determined by the study design. Using the wrong one is a common and serious statistical error.
A Visual Guide to Choosing Your Test
With these decision points in mind (goal, data structure, variable type), we can use a flowchart to navigate to the correct statistical test. This is a visual representation of the logic you'll use on every project.
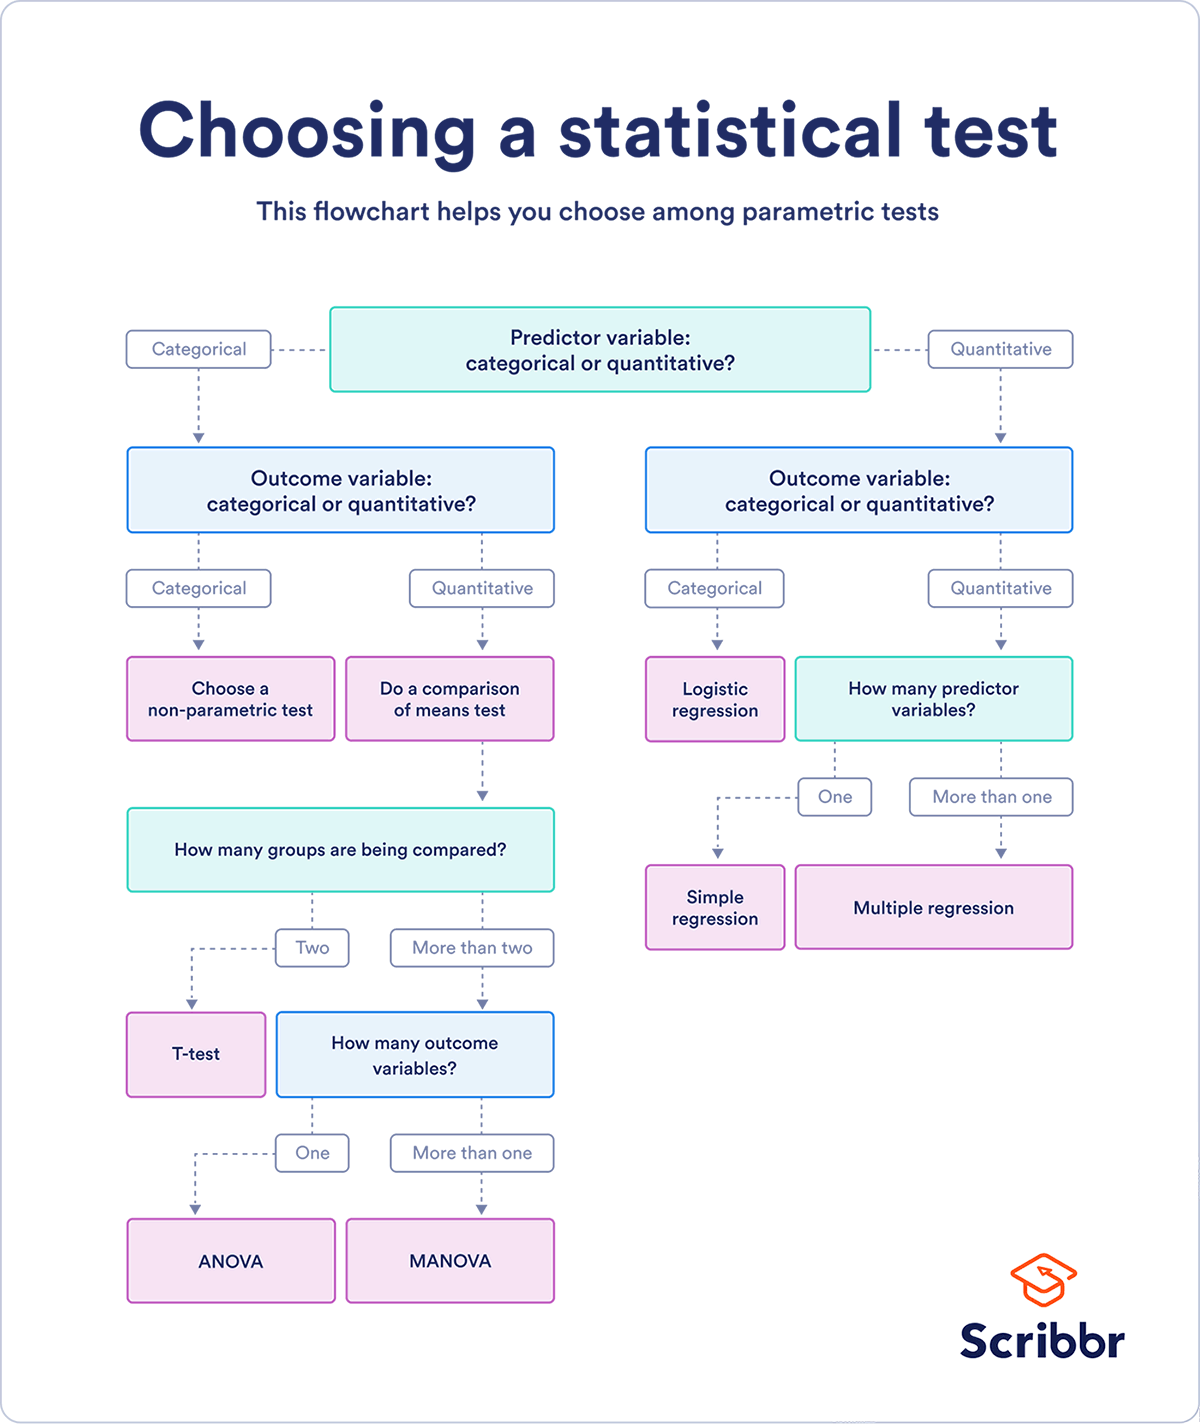
Let's trace an example. Imagine an RCT where you want to compare the mean blood pressure (a quantitative outcome) between a new drug group and a placebo group (a categorical predictor with two groups).
- Predictor variable: Categorical.
- Outcome variable: Quantitative.
- This leads to "Do a comparison of means test."
- How many groups? "Two."
- This leads to the T-test.
Another useful visual tool is a matrix, which is particularly helpful when you have already classified your input (independent) and outcome (dependent) variables.
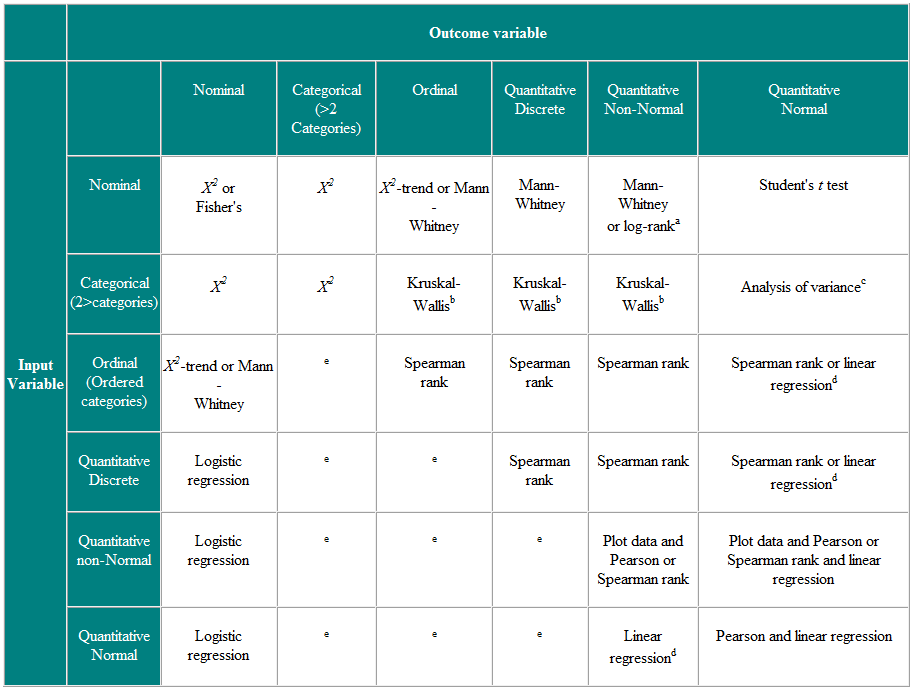
For instance, if you're conducting a cohort study to see if smoking (a categorical input variable) is associated with the development of heart disease (a nominal outcome variable like 'yes'/'no'), the table points you toward a Chi-squared () test.
How Study Design Dictates Key Analytical Measures
Beyond just the name of the test, the study design fundamentally determines the specific measure of effect you can—and should—report. This is a point of frequent confusion, and getting it right is a hallmark of a good biostatistician.
The article "How to write statistical analysis section in medical research" explains this connection perfectly.
How to write statistical analysis section in medical research - PMC
This article details best practices for reporting statistical analysis. We will focus on the section that links study design directly to the choice of effect measure.
Please read the section titled Step 2. Pay close attention to Figure 2 within that section, which visually connects cohort, case-control, and cross-sectional designs to their appropriate effect sizes.
As the article makes clear, there are specific rules:
- Case-Control Studies: You start with the outcome (cases vs. controls) and look backward at exposure. Because you don't know the true incidence of the disease in the population, you cannot calculate risk directly. The appropriate measure is the Odds Ratio (OR).
- Cohort Studies and RCTs: You start with the exposure (or intervention) and follow subjects forward to see who develops the outcome. Because you are tracking new cases over time, you can calculate the incidence of the outcome in each group. This allows you to compute the Relative Risk (RR) or Risk Ratio.
The RR is generally more intuitive for clinicians ("Smokers are 10 times more likely to develop lung cancer"), but it can only be calculated from designs that follow people forward in time. The OR is your only option for a case-control study. Your ability to explain this distinction to a client is a key freelance skill.
A Practical Framework for Making the Decision
Let's synthesize this into a step-by-step process you can apply to any research scenario. The following video provides an excellent walkthrough of this kind of thinking.
How to Use SPSS: Choosing the Appropriate Statistical Test
This video from the Biostatistics Resource Channel demonstrates a systematic process for choosing a statistical test and provides several clear, diagram-based examples.
First, watch the segment on drawing a diagram of your analysis. This is a powerful technique to visualize your variables and study design. Then, watch the walkthrough of several practical examples, from comparing genders on depression to analyzing a pre-post training effect.
Let's apply this thinking to a few common medical research scenarios:
Scenario 1: A Randomized Controlled Trial
- Research Question: "Does Drug A reduce systolic blood pressure (SBP) more than a placebo after 6 weeks?"
- Study Design: RCT.
- Analysis:
- Question Type: Group Comparison (Drug A group vs. Placebo group).
- Variables:
- Independent Variable (IV): Treatment Group (Categorical: Drug A, Placebo).
- Dependent Variable (DV): Change in SBP from baseline (Numerical/Continuous).
- Data Structure: Unpaired/Independent groups.
- Diagram: A table with two columns (Drug A, Placebo) and one row (Mean change in SBP).
- Statistical Test: Independent Samples T-Test.
Scenario 2: A Case-Control Study
- Research Question: "Is a history of smoking associated with pancreatic cancer?"
- Study Design: Case-Control.
- Analysis:
- Question Type: Association.
- Variables:
- IV: Smoking History (Categorical: Ever Smoker, Never Smoker).
- DV: Patient Group (Categorical: Pancreatic Cancer, Control).
- Data Structure: Unpaired/Independent groups.
- Diagram: A 2x2 table (Smoking by Cancer Status).
- Statistical Test: Chi-Square Test, which will be used to calculate the Odds Ratio (OR).
Scenario 3: A Pre-Post Study
- Research Question: "Does a 3-month diet intervention change patients' weight?"
- Study Design: A simple cohort followed over time, with a "before" and "after" measurement.
- Analysis:
- Question Type: Group Comparison (comparing the "before" state to the "after" state).
- Variables:
- IV: Time (Categorical: Baseline, 3 Months).
- DV: Weight (Numerical/Continuous).
- Data Structure: Paired data (the same people are measured twice).
- Diagram: A table with two columns (Baseline Weight, 3-Month Weight) and one row for the subjects.
- Statistical Test: Paired Samples T-Test.
Conclusion
In this lesson, you have connected the theoretical world of study design to the practical world of statistical analysis. You've learned that the design is not just an abstract concept; it is the master plan that dictates your entire analytical strategy.
Here are your key takeaways:
- The choice of a statistical test is a logical process based on the research goal, the types of variables, and the data structure (paired or unpaired).
- The study design is the primary factor that determines this structure. An RCT with two independent arms naturally leads to an unpaired test, while a pre-post study on the same subjects naturally leads to a paired test.
- Different observational designs allow for different measures of association. Cohort studies allow for the calculation of Relative Risk (RR), while case-control studies are limited to the Odds Ratio (OR).
- Using visual aids like flowcharts, matrices, and simple diagrams can greatly clarify which test is appropriate for a given research question.
You have now completed the first module and have a solid conceptual foundation in medical research. You know how to classify variables, identify study designs, and understand how those designs lead to specific analytical choices.
In our next lesson, we will begin Module 2: SPSS Fundamentals and Data Management. We will leave the "why" behind for a moment and focus on the "where." You will get your hands on the software for the first time, learning to navigate its interface and import your first dataset. This is the first practical step toward running the analyses we've just discussed.