Introduction
In our last lesson, you crafted a compelling narrative for your case study, giving it a strong, persuasive voice. Today, we'll focus on making that story visually undeniable. An effective case study doesn't just tell the reader about your process; it shows them. We'll be creating the powerful visuals that serve as evidence for your design story.
Your learning outcome for this lesson is to create supporting visuals for a case study, such as user flow diagrams and before/after comparisons. Think of this as preparing the exhibits for your case. Your background in audit, where charts and evidence are used to substantiate a narrative, will be particularly useful here. You'll learn how to transform abstract processes and design solutions into clear, impactful diagrams and images that a potential client can understand at a glance.
1. Showing, Not Just Telling: The Power of Visuals
Recruiters and clients are busy. They often scan a case study before committing to reading it. Strong visuals grab their attention, make your process understandable, and prove your impact far more quickly than text alone.
Let's see a practical example of how shifting from text to visuals can transform a case study from merely good to great.
How to design a SMASHING UX portfolio case study that will get you hired.
This video, "How to design a SMASHING UX portfolio case study" by Samuel Fabayo, excellently demonstrates the impact of visuals.
Watch these key segments to see a real case study being improved: Improving the overview: Notice how a static image is replaced with a more engaging, dynamic visual to tease the solution. Replacing text with visuals: This is the most crucial part. Observe how long paragraphs about user research and solutions are replaced with headings, summary images, and video prototypes. Final before and after: This side-by-side comparison clearly shows the power of a visually-driven presentation.
The key takeaway is that visuals make your work more engaging, easier to skim, and ultimately, more convincing. We will now focus on creating three specific types of visuals that are essential for any strong case study.
2. Visual Type 1: User Flow Diagrams
A user flow diagram is a chart that shows the path a user takes through a product to complete a specific task. In a case study, it demonstrates that you think logically about the user's journey and can design an efficient path from start to finish.
What is a user flow? Why it's important in UX design
This article from Figma's official blog provides a fantastic foundation on user flows.
Please read the following sections: Start with "What is a user flow?" and "Why is user flow important in UX design?" to understand the core concept. Continue to "How to create a user flow in five steps" for a clear, step-by-step process. Read "User flow best practices" to understand the principles of creating effective flows. Finally, review "Differentiating user flows from similar charts" to understand how a user flow differs from a journey map or sitemap.
Now that you understand the theory, let's see it in action. Since you are already proficient in Figma, creating these diagrams in its sister tool, FigJam, will be a natural next step.
The video "User Flow Design In FigJam" by Nick Babich provides a concise, practical walkthrough.
Watch the entire video to see how to build a user flow from scratch. Pay close attention to: The five key elements: Understand the standard shapes for start/end points, pages, decisions, and arrows. The practical example: Follow along as he builds a sign-in flow, considering different paths like password resets and new device logins. Note how he uses solid vs. dashed lines to differentiate primary and alternative paths.
3. Visual Type 2: Before & After Comparisons
This is arguably the most powerful visual in a designer's toolkit. It instantly communicates the value you added by contrasting the old problem with your new solution. It's a visual "return on investment."
There are several ways to present a before-and-after:
A) Process Improvement: Show how your work made a workflow more efficient. This is perfect for your design system case study.

B) Fidelity Progression: Show the evolution of your design from a low-fidelity sketch to a high-fidelity mockup. This demonstrates a structured design process.
UX Design: Prototype & Annotations from Interaction Sketches
This article by Gisell Quignard provides a great example of showing design progression.
Focus on the sections "From Sketch to Prototype" and "Mid-Fidelity Prototype." Look at the images. The first image shows rough hand sketches ("before"), and the subsequent images show the polished digital screens in Figma ("after"). This is a classic way to visualize your process.
C) UI Redesign: This is a direct comparison of an old interface with your new, improved version.
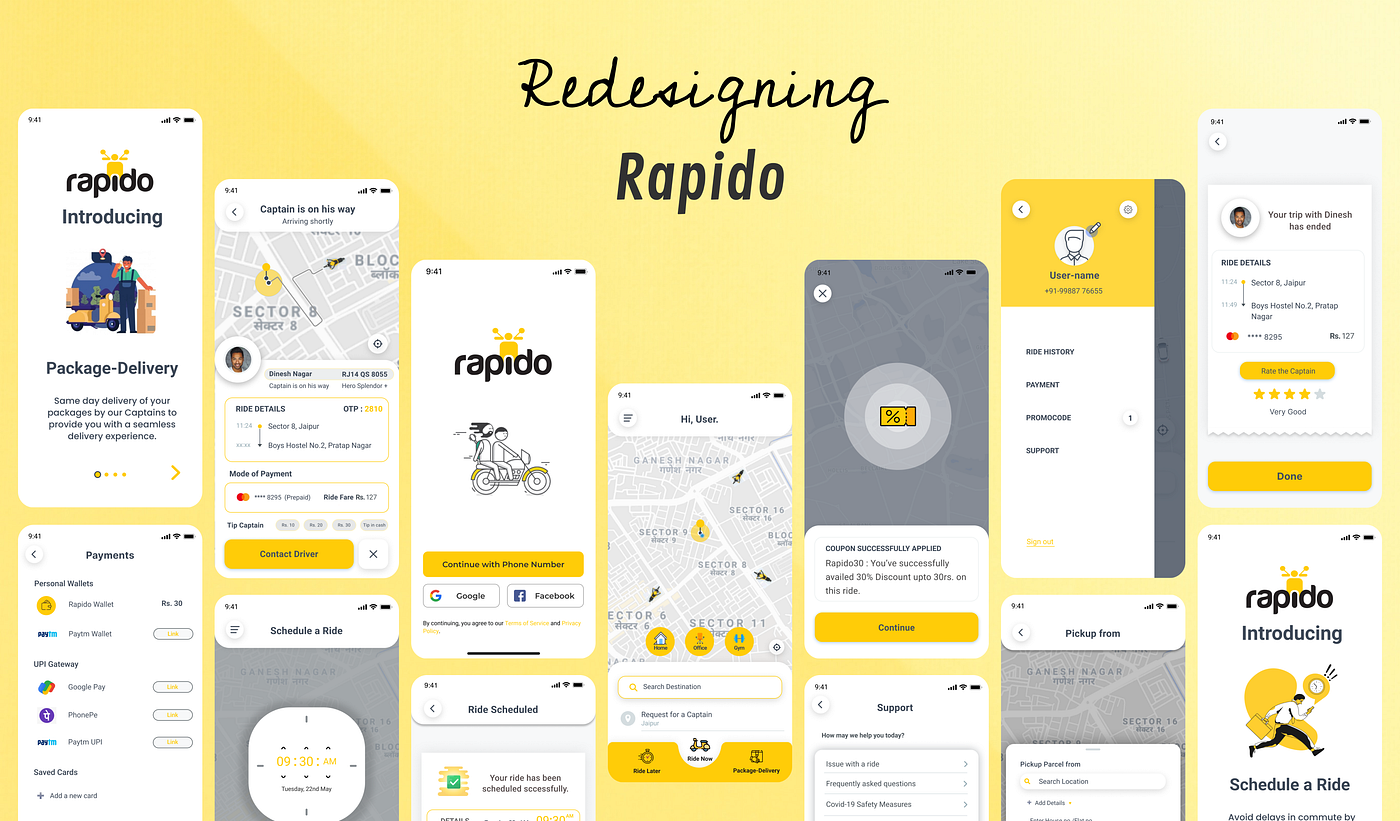
4. Visual Type 3: Annotated Mockups
Annotated mockups are screenshots of your design with callouts and notes explaining the rationale behind specific decisions. This visual is critical for demonstrating your attention to detail and ability to communicate with developers. Your experience in finance, where every line item in a report must be justifiable, aligns perfectly with this practice.
Let's return to the case study example to see how this is done effectively.
UX Design: Prototype & Annotations from Interaction Sketches
This part of the article provides excellent examples of annotations.
Read the section "Annotations for Developers" to understand the purpose of annotations. Then, scroll down to the images under "Annotations Wireframe Overview." You will see screens with red boxes and text explaining functionality, states, and interactions. This is exactly what an annotated mockup looks like.
Your Turn: Create Your Case Study Visuals
Now it's time to apply these concepts to your own design system case study.
Activity 1: Create a "Before & After" User Flow (30 minutes)
Your goal is to visually represent the efficiency gain from your design system.
- Open FigJam.
- Create the "Before" Flow: Map out the process of designing a simple screen (e.g., a login page) without a design system. Your steps might include: "Draw rectangle for button," "Search for brand hex code," "Set font size for heading," "Manually check spacing," etc. This flow should look a bit convoluted.
- Create the "After" Flow: Now, map out the same process with your design system. Your steps will be much simpler: "Drag button component from library," "Apply 'Heading 1' text style," "Use Auto Layout for spacing," etc. This flow should look clean and linear.
- Place these two flows side-by-side, just like in the "Revised Flow vs Old Flow" image. This will become a cornerstone visual for your case study.
Activity 2: Create an Annotated Mockup (15 minutes)
Choose one of the more complex components you built for your design system (like a card or a form input).
- Take a screenshot of the component in its various states (e.g., default, hover, focused, error).
- Place the screenshot in a Figma or FigJam file.
- Add text annotations and arrows, just as you saw in the "Annotations for Developers" example. Explain the rationale. For example:
- "Uses 8pt spacing token for vertical rhythm."
- "Error state includes an icon and helper text for accessibility (WCAG)."
- "All variants are built with Auto Layout to accommodate dynamic content."
This exercise will produce a visual that proves you don't just make things look good; you build them with logic and scalability in mind.
Conclusion
You now have a powerful set of tools to visually communicate your design process and impact. By creating compelling visuals, you make your case study more scannable, engaging, and persuasive for potential clients.
Key Takeaways:
- Visuals are not decoration; they are the evidence that backs up your design narrative.
- User flow diagrams demonstrate your ability to think through user journeys logically.
- Before/after comparisons are the most direct way to prove the value and impact of your work.
- Annotated mockups showcase your attention to detail and readiness to collaborate with developers.
Preview of the Next Lesson:
You've written your narrative and created the supporting visuals. Your case study content is now complete! In the next lesson, we will explore where to showcase your work. We'll be focusing on comparing portfolio platform types (e.g., Behance, Webflow, personal site) for freelance positioning, helping you choose the best stage for your story.