Introduction
In our last lesson, you did an excellent job synthesizing data from multiple interviews to construct a user persona. That persona gives us a clear answer to the question, "Who are we designing for?" It acts as a stable, summary profile of your target user.
Today, we're going to dive one level deeper. While a persona gives us a portrait of the user, an empathy map gives us a snapshot of their mind and experience in a specific situation. Our goal is to create an empathy map to visualize what a user thinks, feels, says, and does. This tool is invaluable for moving beyond assumptions and building a genuine, shared understanding of the user's world—a skill that is critical for justifying design decisions to future clients.
Think of it this way: a persona is like an annual financial statement for a company, giving you a comprehensive overview. An empathy map is like a detailed cash flow analysis for a specific quarter, showing you the operational reality—the inputs, outputs, and underlying sentiments—in a focused context.
What is an Empathy Map?
At its core, an empathy map is a collaborative tool used to articulate what we know about a particular type of user. It helps teams get inside a user's head to make better, more user-centered decisions. The first step is understanding what we mean by empathy in a design context.
Let's start with a short video from the Google UX Design Certificate that defines empathy and introduces the empathy map as a tool to build it.
The Importance of Empathy in UX Design | Google UX Design Certificate
This video from Google Career Certificates provides a concise explanation of empathy in UX and introduces the structure of an empathy map.
Please watch the following sections: Empathy in UX: Pay attention to the distinction between empathy, sympathy, and pity. This will help you articulate the value of this work to clients. Introducing empathy maps: This part introduces the classic four-quadrant structure that we will be building.
As you saw, the map is typically divided into four quadrants that capture a user's experience.
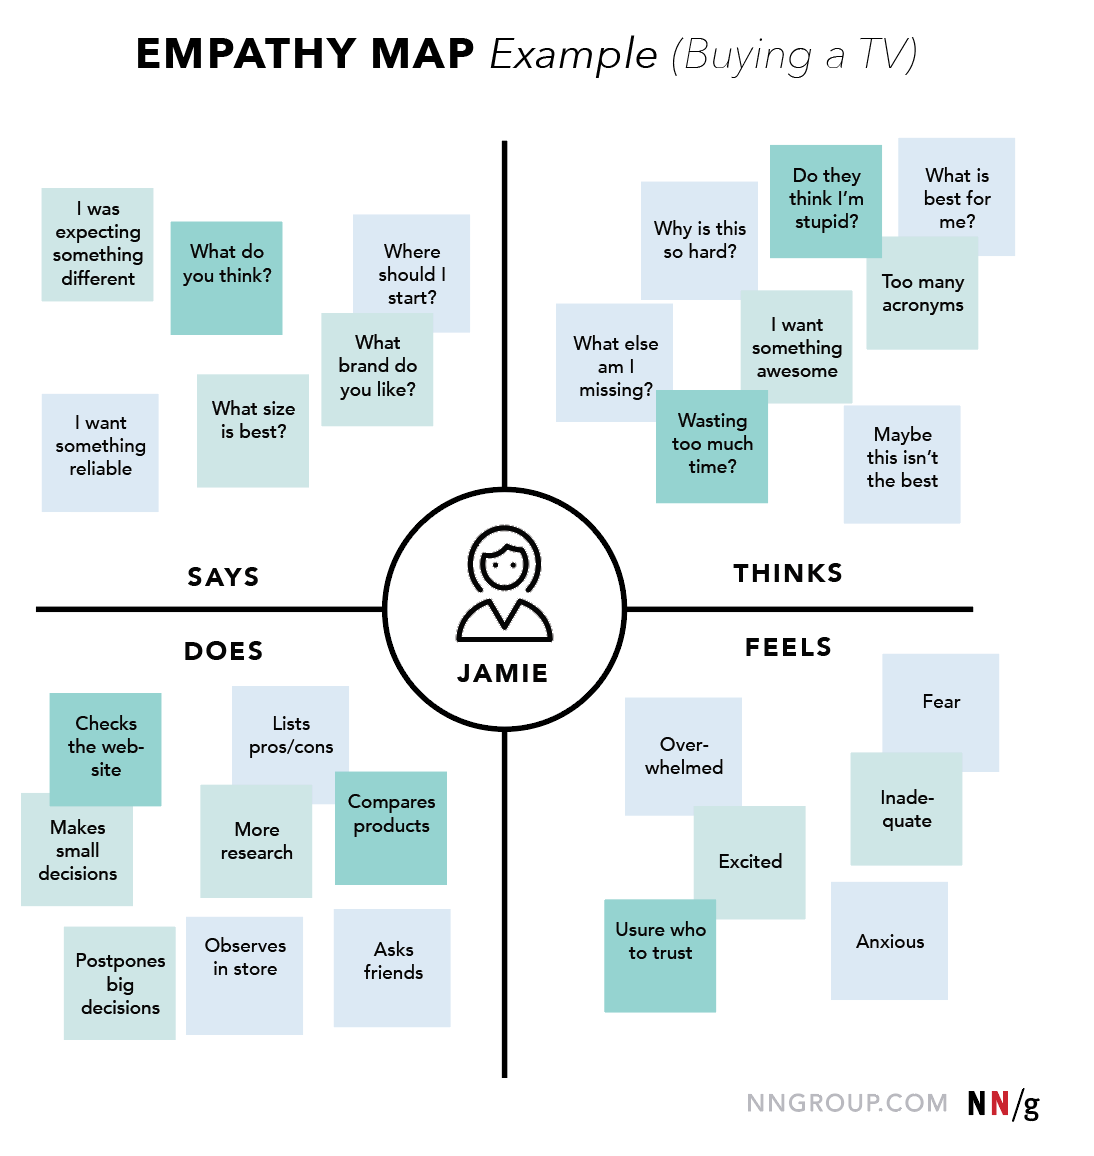
The four core quadrants are:
- Says: What the user says out loud. These are direct quotes gathered from interviews or usability tests.
- Thinks: What the user is thinking throughout the experience. These are thoughts that may not be spoken aloud and are often inferred from their behavior and expressions.
- Does: The actions and behaviors the user takes. This is what we can physically observe them doing.
- Feels: The user's emotional state. This captures their feelings, such as frustrated, anxious, confused, or excited.
This structure forces us to consider the user from multiple angles and, importantly, to notice any contradictions—for example, when what a user says doesn't match what they do. These contradictions are often where the most powerful design opportunities lie.
How to Create an Empathy Map
Creating an empathy map is a process of synthesizing your research data into this four-quadrant framework. Given your analytical background, you'll appreciate that it's a structured method for processing qualitative data.
Let's review a step-by-step guide to this process.
Empathy Mapping: Bridging the User-Design Gap | Maze
This article from Maze provides a clear, actionable framework for creating and using an empathy map. It will give you a solid process to follow in your future freelance projects.
Please read the section titled "7 Steps to create and use a customer experience empathy map". Focus on understanding the flow: Set goals: Define who you are mapping and what you want to learn. Identify your audience: Choose the persona or user segment. Gather materials & conduct research: Collect the data to populate your map. Populate each quadrant: This is the core mapping activity. Synthesize insights: Look for patterns and contradictions. Share with stakeholders: Use the map as a communication tool. Inform design: Translate insights into action.
Your Turn: Create an Empathy Map in Figma
Now it's time to put this into practice. In the previous lesson, you worked with interview summaries for Priya, Aisha, and Rahul to create a user persona. We will now use that same data to create an empathy map.
This is a perfect example of how personas and empathy maps work together. The persona represents "The Discerning Event Planner." The empathy map will help us understand what this planner experiences during the specific scenario of searching for and buying decor online.
First, let's watch a short video on how to facilitate an empathy mapping session remotely using Figma. This is a highly practical skill for a freelance designer.
UX Design For Beginners : empathy maps exercise 101
This video by designer Charli Cheung demonstrates the hands-on process of creating an empathy map, including how to set it up directly in Figma.
Watch these two key parts: Setting up the map: See how to draw the simple four-quadrant layout. Remote mapping in Figma: This shows you exactly how to use Figma's tools to create digital sticky notes and populate the map, a skill you can use immediately.
Your Task
- Open a new file in Figma. Create a large frame for your empathy map.
- Following the video's guidance, draw a 2x2 grid and label the four quadrants: Says, Thinks, Does, and Feels. Put the name of our user, let's use Priya, in the center.
- Review the interview summaries from the previous lesson (re-pasted below for convenience).
- For each summary, extract specific data points and add them as "sticky notes" (a simple rectangle with text) to the appropriate quadrant of your map.
- Says: Use direct quotes.
- Does: What actions are they taking? (e.g., "Spends hours on Pinterest," "Compares items").
- Thinks: What are their internal thoughts or beliefs? (e.g., "Sizing is a guessing game," "This is overwhelming"). You will need to infer these.
- Feels: What emotions are they experiencing? (e.g., "Overwhelmed," "Stressed," "Worried," "Frustrated").
Spend about 15-20 minutes on this task. Don't worry about making it perfect; the goal is to practice the act of sorting research data into this framework.
Interview Summaries (from previous lesson):
-
User 1: Priya (Baby Shower Planner)
- Goal: Plan a beautiful, cohesive baby shower for her sister.
- Context: Spends hours on Pinterest and Etsy but feels overwhelmed.
- Pain Points: Worries about product quality ("feels like a gamble"). Stressed about coordinating shipping times from different sellers. Hates doing "detective work" to verify if an item is good.
- Quote: "I don't have time for that kind of detective work for every single piece of decor."
-
User 2: Aisha (Busy Parent)
- Goal: Throw a unique, memorable 1st birthday party for her son.
- Context: A corporate lawyer with very little free time. She's not price-sensitive and is willing to pay for convenience and quality.
- Pain Points: Finds it frustrating to buy items from 10 different shops to create one look. Wants something that feels special, not a generic "party-in-a-box." Overwhelmed by the sheer number of choices.
- Quote: "Just tell me what to buy. I'd happily pay more for a curated set that I know will look amazing and save me 20 hours of searching."
-
User 3: Rahul (Anniversary Planner)
- Goal: Organize an elegant 25th-anniversary dinner for his parents.
- Context: Doesn't use Pinterest and finds visual search sites confusing. He's looking for sophistication, not "cutesy" themes.
- Pain Points: Finds it hard to search for "classy" or "elegant" decor. He's worried about buying something that looks tacky or cheap in person.
- Quote: "My biggest fear is spending hundreds of dollars on things that arrive and look like they belong at a children's party."
Click to see a sample empathy map based on the data
Here's an example of how the data could be organized. Compare it with your own map. It's okay if your interpretations differ slightly!
SAYS
- "I don't have time for that kind of detective work."
- "Just tell me what to buy."
- "My biggest fear is spending hundreds of dollars on something that looks tacky."
- "I'd happily pay more for a curated set."
THINKS
- "This is a gamble."
- "Why are the search results so irrelevant?"
- "This is taking way too much time."
- "I need this to look special and sophisticated, not generic."
- "Coordinating all these sellers is a nightmare."
DOES
- Spends hours on Pinterest and Etsy.
- Buys items from multiple different shops.
- Tries to verify product quality.
- Searches for specific keywords like "elegant" or "classy."
- Avoids generic "party-in-a-box" options.
FEELS
- Overwhelmed by the number of choices.
- Stressed about coordinating shipping and logistics.
- Worried about product quality and items looking "cheap."
- Frustrated with inefficient search and fragmented shopping.
- Confused by visual search sites.
Synthesizing the Map: Pains and Gains
Once populated, the empathy map isn't just a collection of notes; it's a tool for synthesis. Look at your completed map. What are the dominant themes? The "Feels" quadrant is likely full of negative emotions, and the "Thinks" quadrant is full of worries.
This leads us to two bonus sections often added to modern empathy maps: Pains and Gains.
- Pains: What are the user's biggest frustrations, fears, and obstacles? These often come directly from the "Thinks" and "Feels" quadrants.
- Example from our data: Fear of poor quality, wasted time, feeling overwhelmed.
- Gains: What does the user truly want to achieve? What does success look like? This is their ultimate goal or aspiration.
- Example from our data: Feeling confident in their purchase, creating a beautiful and unique event, saving time.
Your background in business and finance makes this step particularly intuitive. Identifying "Pains" is like identifying risks or liabilities. Identifying "Gains" is like defining the desired return on investment for the user. A successful product solves the pains to help the user achieve the gains.
Conclusion
Well done. You have now taken raw research and visualized it through two critical UX lenses: the persona (who the user is) and the empathy map (what the user experiences). You've practiced the essential skill of sorting qualitative data into a structured format and seen how to build this artifact directly in Figma.
Key Takeaways:
- An empathy map provides a snapshot of a user's experience within a specific context, focusing on what they Say, Think, Do, and Feel.
- It's a powerful tool for building empathy and aligning a team around a shared understanding of the user.
- Contradictions between the quadrants (e.g., Saying vs. Doing) often reveal deep user insights.
- Synthesizing the map into Pains and Gains directly connects user needs to business opportunities, which is crucial for making a case to clients.
Preview of the Next Lesson:
We now have a strong understanding of our user's identity and their inner world. In the next lesson, we will zoom out again to map their entire process from start to finish. We'll create a User Journey Map, which visualizes the user's actions, thoughts, and feelings across every touchpoint of their experience. This will allow us to pinpoint exactly where their biggest frustrations occur and where we can have the most design impact.