Hello! Welcome to the tenth module of our course. We've spent the last several lessons focused on ensuring the correctness of our multithreaded programs, using tools like Helgrind, DRD, and Memcheck to hunt down race conditions, deadlocks, and resource leaks. Now, our focus shifts from correctness to performance. A correct program that is too slow is often just as useless as a buggy one.
In this lesson, we will begin our journey into performance analysis and optimization. Our goal is to learn how to profile a multithreaded application using tools like perf to identify performance hotspots. A "hotspot" is a section of code—usually a function or a tight loop—that consumes a disproportionate amount of system resources, typically CPU time. Finding these hotspots is the critical first step in making your applications run faster.
The Profiling Mindset: From "Does it work?" to "Does it scale?"
For single-threaded applications, performance analysis is often a straightforward search for the most time-consuming function. In multithreaded applications, the picture is more complex. The primary goal of multithreading is often to achieve scalability—the ability to do more work by adding more threads (and utilizing more CPU cores).
An ideal multithreaded application exhibits linear scaling: if you double the number of threads, you halve the execution time. In reality, this is rarely achieved. Communication and synchronization overhead (like waiting for a mutex) create bottlenecks that prevent perfect scaling. Our job as performance engineers is to find and minimize these bottlenecks.
Introducing perf: The Swiss Army Knife of Linux Profiling
The primary tool for this job on Linux is perf. It's a powerful and versatile command-line utility that interfaces with the kernel's Performance Monitoring Unit (PMU) to collect detailed information about a program's execution.
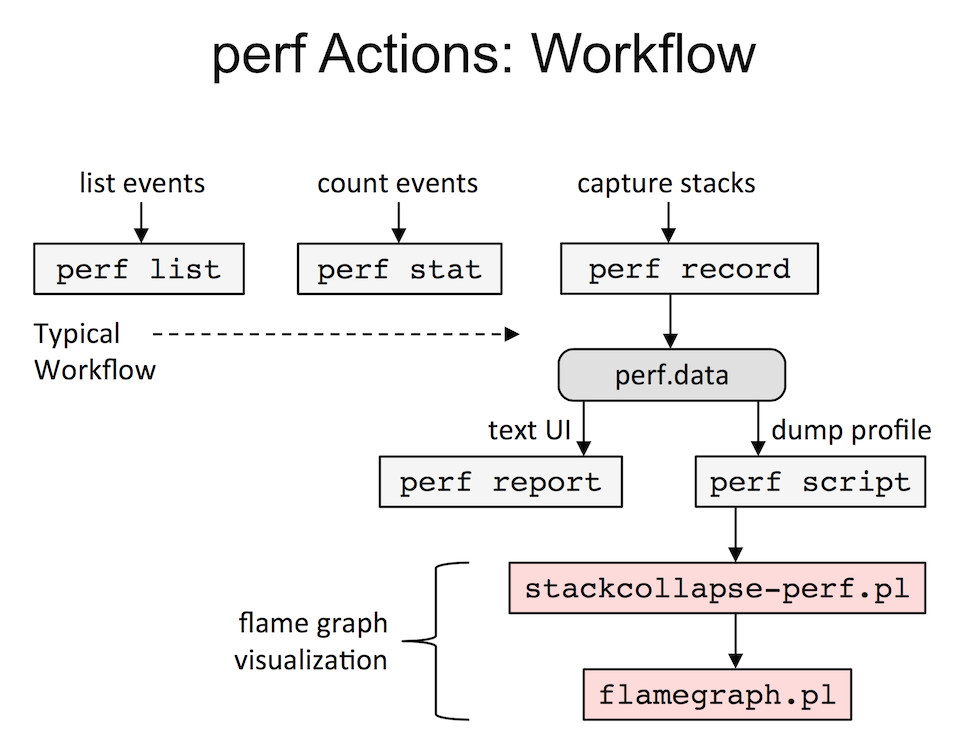
The perf tool has many commands, but we'll focus on the core workflow for identifying hotspots. This diagram illustrates the general process we'll be following.
Step 1: High-Level Analysis with perf stat
Before diving deep, it's useful to get a high-level summary of an application's performance. The perf stat command runs a program and collects aggregate statistics about various performance events.
Let's look at a practical analysis from an excellent blog post on the topic.
Performance analysis of multithreaded applications
This article from easyperf.net provides a concrete, step-by-step guide to analyzing a multithreaded H.264 decoder. We will use its methodology throughout this lesson.
First, read the sections "Benchmark under the test" and "Performance scaling" to understand the setup. Note the scaling graph, which shows performance gains flattening after 4 threads—a classic sign of a bottleneck. Then, read "CPU utilization" and "Synchronization overhead" to see how perf stat is used. Pay close attention to how the author compares the number of retired instructions between the 1-thread and 8-thread runs to deduce the presence of synchronization overhead.
As the article demonstrates, a powerful technique is to run perf stat with varying thread counts and compare the results. Let's break down the key insights from the article's perf stat output:
- Wall Time vs. CPU Time: Notice that for the 8-thread run, the
usertime (128s) is much larger than thetime elapsed(22.7s). This is expected in a multithreaded app; it's the sum of time spent across all CPU cores.(user + sys) / elapsedgives you the average CPU utilization. - Instruction Overhead: This is a crucial insight. The 8-thread run executed 36% more instructions than the 1-thread run to accomplish the exact same task. Where did these extra instructions come from? They aren't doing useful decoding work. They are a symptom of overhead, most likely threads spinning in a loop waiting for a lock to be released.
perf stat gives us the "what" (there is a scaling problem and overhead) but not the "where". For that, we need to sample the application's execution.
Step 2: Pinpointing Hotspots with perf record and perf report
The core of profiling with perf is a two-step process:
perf record: Run the application and collect a profile by taking thousands of "samples". A sample is a snapshot of the program's state (primarily the instruction pointer) taken whenever a specific event occurs, most commonly after a certain number of CPU cycles have passed. This generates aperf.datafile.perf report: Analyze theperf.datafile and present an interactive, sorted list of functions where the most samples were taken. Functions at the top of this list are our hotspots.
To understand the commands and their output, this reference tutorial is very helpful.
Linux kernel profiling with perf
This wiki page is the definitive tutorial for perf. We will use it as a reference to understand the commands and options we are using.
Skim the section "Sampling with perf record" to understand the basic command and the concept of event-based sampling. Then, read the section "Sample analysis with perf report" more carefully. Focus on the explanation of the output columns: Overhead, Command, Shared Object, and Symbol. Also, note the discussion of 'Children' vs. 'Self' overhead.
Here's an example of what perf report output looks like.

A Practical Workflow for Multithreaded Profiling
Now, let's combine these tools into the powerful workflow demonstrated in the easyperf.net article to find our multithreaded bottleneck.
Performance analysis of multithreaded applications
Let's return to the easyperf.net article to see the record/report workflow in action.
Read the section "Profiling multithreaded apps". This is the core of our lesson. Follow the author's process: Run perf record for 1, 4, and 8 threads, saving the output to separate files. Run perf report on each file. Compare the overhead percentage for the function ed_rec_thread across the different runs. This dramatic increase in overhead is the 'smoking gun' that identifies the scalability bottleneck.
The key takeaway from this workflow is the comparative analysis. A function whose relative Overhead grows significantly as you add more threads is almost certainly related to a scalability bottleneck. In the article's example, ed_rec_thread went from a negligible 0.18% with one thread to a massive 17.53% with eight threads. The work being done hasn't changed, but the time spent waiting and fighting with other threads has exploded. The article confirms this by finding a busy-wait loop (a spinlock) inside that function's call tree.
Test your understanding!
You are profiling a multithreaded image processing application. Your goal is to apply a filter to an image in parallel by dividing the image into tiles. Here are simplified perf report outputs.
Run 1: 1 Thread
Overhead  Symbol
--------  ----------------
  85.10%  apply_filter
   5.30%  read_image_data
   ...
Run 2: 8 Threads
Overhead  Symbol
--------  ----------------
  45.50%  pthread_mutex_lock
  35.20%  apply_filter
   8.10%  write_tile_to_buffer
   ...
What is the most likely performance hotspot that is preventing the application from scaling well? Explain your reasoning based on the reports.
Show answer
The most likely performance hotspot is excessive contention on a mutex, identified by the pthread_mutex_lock function consuming 45.50% of the execution time in the 8-thread run.
Reasoning:
In the single-threaded version, the vast majority of time is spent in apply_filter, which is the actual, useful work. When moving to 8 threads, the apply_filter function's relative overhead drops, but a huge new hotspot appears: pthread_mutex_lock. This function was not a factor in the single-threaded case. Its dramatic appearance and dominance in the 8-thread profile indicates that threads are spending nearly half their time waiting to acquire a lock, rather than doing the actual image processing. This is a classic scalability bottleneck.
Beyond the Basics: Other perf Techniques
perf is incredibly deep. While the record/report workflow is your primary tool, here are a few other capabilities worth knowing about.
- Per-Thread Analysis: The easyperf.net article briefly mentions this. If you suspect one particular thread is behaving badly, you can use
perf report -Tto list all threads and thenperf report --tid <ID>to analyze only the samples from that specific thread. - Source Code Annotation: Once you've found a hot function with
perf report, you can useperf annotate <function_name>to see a disassembly of the function with the overhead percentage next to each instruction. If your program was compiled with debug symbols (-g),perfcan even interleave the original C source code. This lets you go from a hot function to the exact hot loop or line of code. - Flame Graphs:
perfhas built-in support for generating Flame Graphs (perf script report flamegraph), a powerful visualization that helps you understand the call stacks of your application at a glance. They provide an intuitive view of where time is being spent.
Conclusion
You now have a foundational method for analyzing the performance of your multithreaded C programs. By moving beyond just measuring total runtime and instead looking at how performance characteristics change with thread count, you can systematically uncover the bottlenecks that prevent your code from scaling.
Key Takeaways:
- Profiling multithreaded applications is about finding scalability bottlenecks.
- The primary
perfworkflow is toperf recordyour program's execution and thenperf reportto analyze the collected samples. - Functions with high
Overheadin theperf reportoutput are your hotspots. - The most powerful analysis technique is to compare
perfreports from runs with different numbers of threads. A function whose overhead percentage explodes as threads are added is a strong indicator of a synchronization bottleneck.
Preview of the Next Lesson:
In this lesson, we saw how a hotspot that gets worse with more threads often points to a synchronization problem like lock contention. Our perf report showed pthread_mutex_lock as a hotspot, but how can we be sure? In the next lesson, we will learn how to measure lock contention to identify synchronization bottlenecks, using advanced perf features to directly prove and quantify the time threads spend waiting for locks.