Hello! Welcome back to our module on performance analysis and optimization.
In the previous lesson, we learned how to use perf to identify performance hotspots in multithreaded applications. We discovered that a key sign of a synchronization bottleneck is when the relative overhead of a function like pthread_mutex_lock increases dramatically as you add more threads. This is a strong clue that threads are spending too much time waiting for each other.
Today, we'll move from inferring contention to measuring it. Our goal is to answer critical questions like: How much time are my threads actually spending blocked on a lock? Which specific locks are causing the most trouble? Understanding this is essential for effective optimization.
This lesson will equip you to measure lock contention to identify synchronization bottlenecks. We'll explore a spectrum of techniques, from analyzing the side effects of contention to directly measuring wait times with code instrumentation.
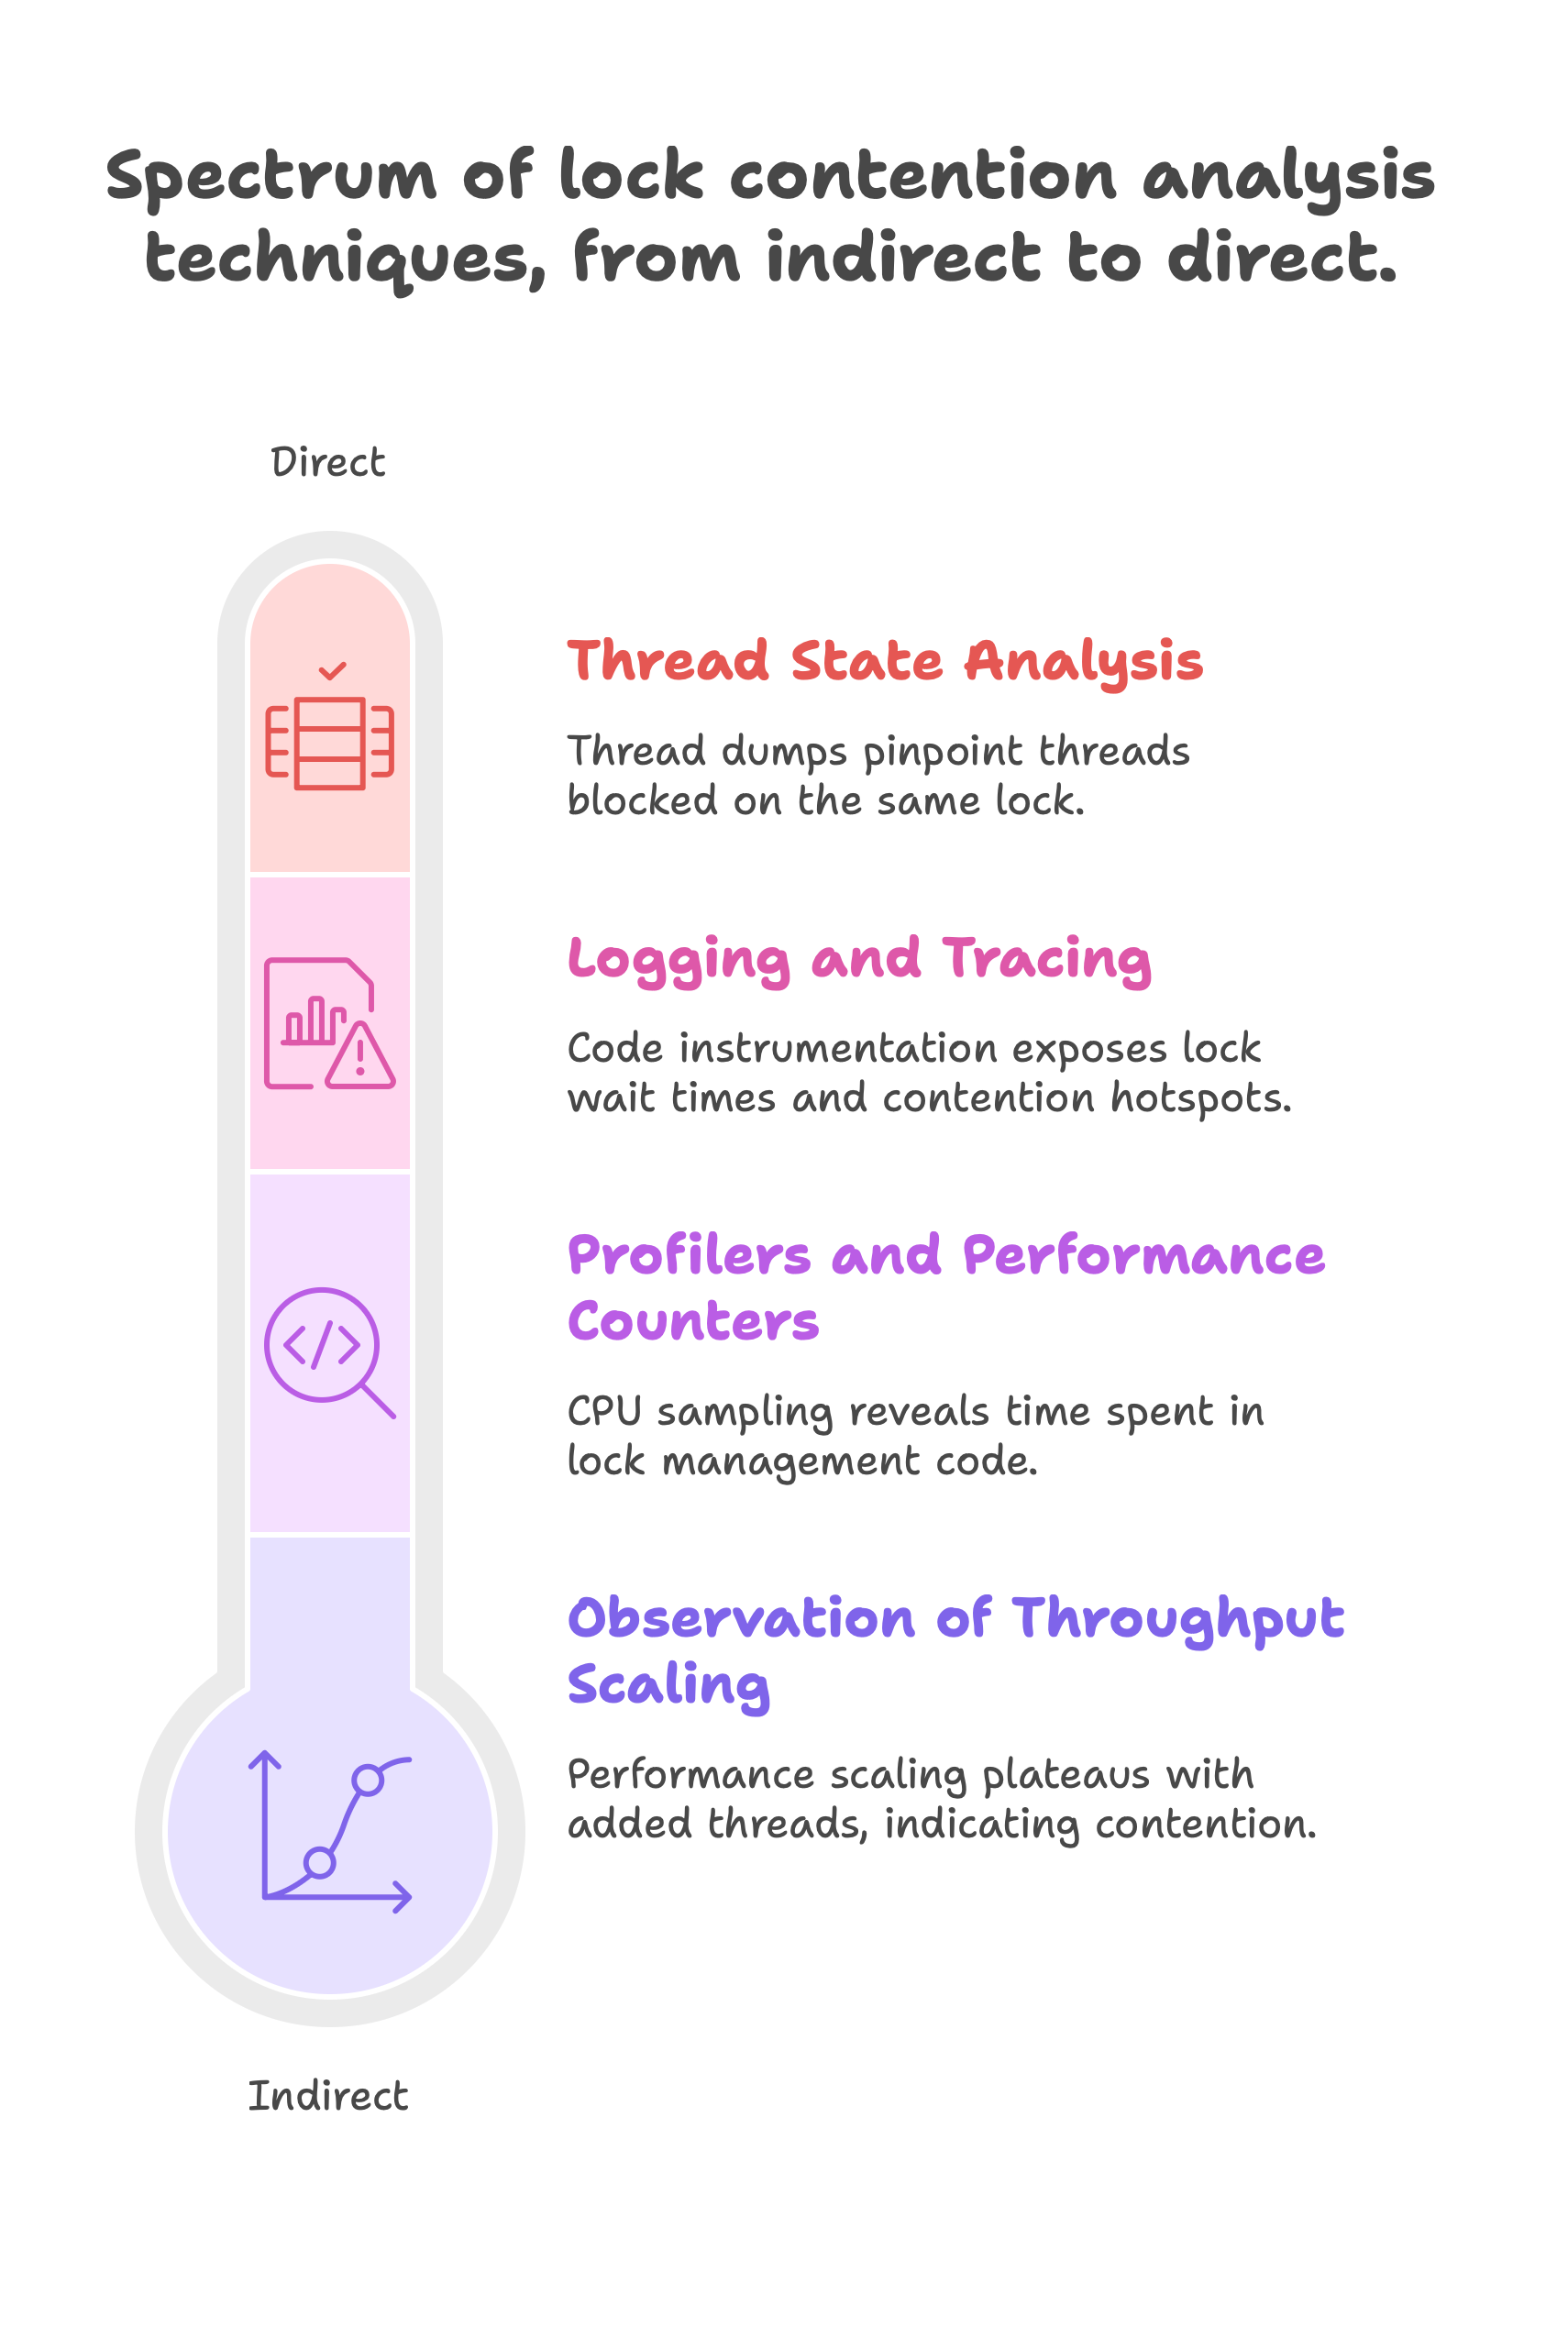
Indirect Measurement: Observing the Symptoms
The simplest way to detect contention is to observe its side effects. As we saw in the last lesson, poor performance scaling is a major symptom. Another powerful indicator is an increase in cache misses.
When multiple threads on different CPU cores contend for the same lock, the cache line containing the lock variable must be constantly shuttled between those cores. This process, often called "cache line bouncing" or "cache ping-ponging," invalidates the cache lines on other cores and forces them to re-fetch the data from a higher-level cache or main memory. This is slow and generates a high number of cache misses.
The following video, which introduces spinlocks, provides a perfect demonstration of this phenomenon. While its primary topic is spinlocks, its benchmarking methodology is highly relevant for us.
Spinlocks - Part 1 - A Basic Spinlock
Watch this segment from the video 'Spinlocks - Part 1' by Nick. The author sets up a high-contention benchmark and then uses perf stat to show how contention manifests as a very high L1 data cache miss rate.
Watch from 04:53 to 09:23. First, understand the benchmark setup (04:53 - 06:06), which is designed to create heavy contention. Then, pay close attention to the analysis (06:06 - 09:23) where the author runs the benchmark and uses perf stat -d to reveal a very high L1-dcache-load-misses percentage. This is a classic symptom of the cache-line bouncing caused by lock contention.
This perf stat approach is a great first step. If you see poor scaling and a high cache miss rate that grows with the number of threads, you have strong evidence of a contention bottleneck.
Advanced perf Techniques for Contention Analysis
perf stat tells us that there's a problem, but it doesn't tell us where. To get more specific, we can use more advanced perf sub-commands.
Pinpointing Contended Cache Lines with perf c2c
Since lock contention often manifests as cache-line bouncing, a tool that can pinpoint exactly which cache lines are being fought over is invaluable. That tool is perf c2c (cache-to-cache). It records memory accesses and identifies cache lines that frequently cause "HitM" (Hit on a Modified cache line) events. A HitM event occurs when a core tries to access data and finds that another core has exclusive, modified ownership of that cache line, forcing a costly cross-core coherency transaction. This is the hardware-level signature of contention.
This next video explains perf c2c in the context of debugging false sharing, but the principles and tools are identical for analyzing the true sharing that occurs with lock variables.
The video 'Advanced Topics: Perf C2C' by Nick provides an excellent tutorial on using perf c2c. It will show you how to record data and interpret the report to find the source of cache contention.
Watch from the beginning to 08:38. (00:00 - 04:42): Understand the concept of cache coherence, why writes cause invalidations, and how this leads to performance issues. (04:42 - 06:30): Learn the basic commands: perf c2c record and perf c2c report. Pay attention to the explanation of a 'HitM' event as the key metric for contention. (06:30 - 08:38): See how to drill down into the report to find the specific cache line, the memory offsets being accessed, and even the source code responsible for the contention. This is the most critical part.
By using perf c2c, you can definitively prove that the memory location of your mutex is a point of high contention at the hardware level.
What About perf lock?
You might have discovered the perf lock command and thought it's the perfect tool for this job. Unfortunately, it's not that simple for standard user-space mutexes.
Does perf lock profile user space mutexes?
This Stack Overflow answer explains why perf lock is not the tool we need for profiling pthread_mutex and what we can do instead.
First, read the summary of the accepted answer (section starting with 'Summary: no, because...'). It clarifies that perf lock relies on kernel tracepoints that pthread_mutex doesn't provide. Then, read the second answer (starting with 'No. But maybe what you need...'). This offers a powerful alternative: using perf record to trace scheduler events.
The key takeaway is that perf lock is for kernel-level locks. However, the suggested alternative is extremely useful. When a thread fails to acquire a pthread_mutex, it's put to sleep by the kernel's scheduler. We can trace these sleep events!
The command to use is:perf record -e sched:sched_stat_sleep,sched:sched_switch -g ./your_program
When you run perf report on the resulting perf.data file, the hotspots will be the locations in your code that are causing threads to go to sleep. If you see pthread_mutex_lock at the top of this report, you have direct evidence that your threads are spending significant time blocked and sleeping on a mutex.
Direct Measurement: Manual Instrumentation
While perf is powerful, the most precise way to measure lock wait times is to modify your code to measure it directly. This technique, called instrumentation, involves adding timing calls around your critical sections.
A fantastic blog post explores this exact topic with practical C++ code that you can easily adapt to C.
Measuring Mutexes, Spinlocks and how Bad the Linux ...
The article 'Measuring Mutexes, Spinlocks...' provides two excellent micro-benchmarks for directly measuring contention. We will focus on the concepts and the code snippets.
Please read the sections 'Measuring Latency' and 'Measuring Idle Time'. For 'Measuring Latency', focus on the simple but powerful code snippet that measures wait time: taking a timestamp before mutex.lock() and another *after` it succeeds. Note the shocking multi-millisecond wait times the author records. For 'Measuring Idle Time', study the alternative snippet. Here, the timestamp is taken before mutex.unlock(). The next thread to acquire the lock then calculates the time since the lock was released. Understand what this measures: how long the lock was available but no waiting thread was scheduled to take it. This isolates scheduler latency from pure contention.
Let's summarize the two measurement techniques from the article:
-
Measuring Wait Time (Contention):
// In C, using clock_gettime(CLOCK_MONOTONIC, ...)
get_time(&time_before);
pthread_mutex_lock(&my_mutex);
get_time(&time_after);
wait_time = time_after - time_before;
This directly measures the total time a thread was blocked waiting to acquire the lock. Aggregating these times (e.g., finding the average or maximum wait time) gives you a hard number for how severe your contention is.
-
Measuring Idle Time (Scheduler Latency):
// Thread A
get_time(&time_before_unlock);
pthread_mutex_unlock(&my_mutex);

// Thread B (the next one to get the lock)
pthread_mutex_lock(&my_mutex);
get_time(&time_after_lock);
idle_time = time_after_lock - time_before_unlock; // From thread A's measurement
This measures the time the lock was free, but a waiting thread couldn't acquire it. This is often due to the OS scheduler not scheduling the waiting thread in a timely manner. High idle times point to system-level issues, not just contention among your application's threads.
Sophisticated commercial profilers often present this information cleanly. While we don't have such a tool for C out-of-the-box, our manual instrumentation is effectively building our own version of this metric.

Test your understanding!
You are analyzing a program where perf report shows pthread_mutex_lock as a major hotspot. You then re-run the program with the two manual instrumentation methods and find the following:
- Average Wait Time: 250 microseconds.
- Average Idle Time: 5 microseconds.
What do these results tell you about the nature of your bottleneck? Is the problem primarily application-level contention or scheduler latency?
Show answer
The results strongly indicate that the bottleneck is application-level contention.
The Wait Time (250µs) is significant and accounts for the time a thread is blocked. The Idle Time (5µs) is very small in comparison. This means that when a lock is released, another waiting thread acquires it almost immediately. There is very little time where the lock is free and no one is taking it.
Therefore, the problem isn't that the OS scheduler is slow to wake up waiting threads. The problem is that the lock is held for long periods, or so many threads are trying to acquire it at once that a long queue forms. The bottleneck lies within the application's logic (how it uses the lock), not the OS scheduler's behavior.
Conclusion
You now have a powerful toolkit for diagnosing and quantifying lock contention. We've moved beyond simple observation to concrete measurement, which is the foundation of effective performance optimization.
Key Takeaways:
- Spectrum of Techniques: Contention analysis ranges from indirect observation (poor scaling, high cache misses) to direct instrumentation.
- Indirect Symptoms: Use
perf statto look for high cache miss rates (L1-dcache-load-misses) that correlate with increased thread counts. - Advanced Profiling: Use
perf c2cto identify specific cache lines under heavy contention (look for 'HitM' events). Useperf recordon scheduler events (sched:sched_stat_sleep) to find where your code is causing threads to block. - Direct Measurement: The most precise method is to instrument your code with high-resolution timers around
pthread_mutex_lockto measurewait time(contention) andidle time(scheduler latency).
Preview of the Next Lesson:
We've learned how to find and measure synchronization bottlenecks. The next logical step is to fix them. In our next lesson, we will focus on the most fundamental optimization strategy: optimizing a critical section by reducing lock hold time. We'll explore practical techniques for moving work outside of the locked region to improve concurrency.