Hello! Welcome back to our journey from the analog to the digital world.
In our last lesson, we traced the fascinating history of the sampling theorem, understanding the different but related problems solved by Harry Nyquist and Claude Shannon. We learned why the theorem was developed and who the key players were. Nyquist gave us the "speed limit" for sending discrete symbols, while Shannon gave us the condition for perfectly reconstructing a continuous signal from its samples.
Today, we transition from the history to the mathematics. Our goal is to derive the sampling theorem by analyzing the spectrum of an impulse-sampled continuous-time signal. We will build the rigorous proof that underpins Shannon's famous declaration. You'll see precisely how the act of sampling in the time domain creates a distinct, predictable pattern in the frequency domain, a pattern from which the original signal can be perfectly recovered—if we follow the rules.
1. A Mathematical Model for Sampling
To analyze sampling using the continuous-time Fourier transform (CTFT), we need a mathematical model that exists in the continuous-time domain. While a real-world sampler creates a discrete sequence of numbers, , our analytical tool will be impulse sampling.
In this model, we represent the sampled signal, which we'll call , as the original continuous-time signal, , multiplied by an infinite train of Dirac delta functions, . This impulse train is defined as:
where is the sampling period.
The resulting impulse-sampled signal is:
Using the sifting property of the delta function, this simplifies to:
This gives us a continuous-time signal that is zero everywhere except at the sampling instants , where it consists of impulses whose "areas" are equal to the sample values .
EE 424 #1: Sampling and Reconstruction
The distinction between a discrete sequence of numbers (point sampling) and this continuous-time impulse model is important for our analysis. These lecture notes from Iowa State University provide a clear explanation.
Please read the section 'Point and impulse sampling' (pages 9-11). Focus on understanding why we use the impulse sampling model for analysis with the CTFT.
2. The Spectrum of a Sampled Signal
Now for the crucial question: What does the spectrum of our impulse-sampled signal, , look like?
From your background in signal processing, you know that multiplication in the time domain corresponds to convolution in the frequency domain. Therefore:
To solve this, we need the Fourier transform of the impulse train, . Since is a periodic function, its Fourier transform is not a continuous function but another impulse train in the frequency domain. The derivation relies on the Fourier series representation of .
EE 424 #1: Sampling and Reconstruction
The same lecture notes provide a concise derivation of the spectrum of the impulse-sampled signal. It leverages the Poisson Sum Formula, which is effectively the Fourier series of the impulse train.
Please read from the beginning of the 'Poisson Sum Formula' on page 7 through the derivation of Equation (14) on page 11. Follow the steps that take you from the Fourier series of the impulse train to the final expression for the spectrum of the sampled signal, X_F^P(\omega). (Note: The resource uses different notation; X_F^P(\omega) is our X_s(\omega), T is our T_s, and \omega_0 is our sampling frequency \omega_s).
After working through the derivation, you arrive at the central result of sampling analysis:
where is the sampling frequency in radians per second.
This equation is profound. It tells us that the spectrum of the sampled signal is a summation of infinitely many copies of the original signal's spectrum, . These copies are scaled by and shifted in frequency by integer multiples of the sampling frequency .
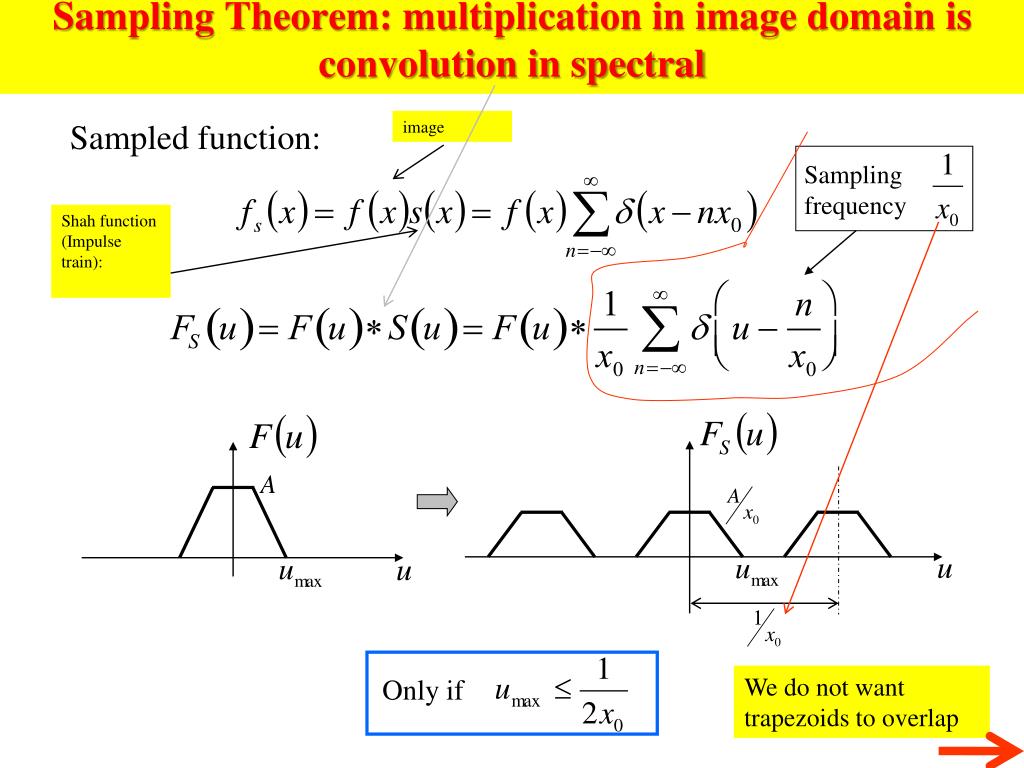
3. Deriving the Nyquist Criterion
Now we can see the sampling theorem emerge directly from this spectral analysis. Let's assume our original signal is band-limited, meaning its spectrum is zero for all frequencies above some maximum frequency, . That is, for .
The video below provides a clear, graphical derivation of the sampling condition based on the spectral replication we just proved.
Lecture 16, Sampling | MIT RES.6.007 Signals and Systems, Spring 2011
This MIT OpenCourseWare video visually demonstrates the effect of sampling on a band-limited spectrum and derives the condition for perfect reconstruction.
Please watch from 02:45 to 07:38. Pay close attention to: (02:45-04:09) The mathematical statement of the spectral replication. (04:09-06:31) The graphical representation of the original and sampled spectra. (06:31-07:38) The geometric argument used to derive the condition for the spectral replicas to not overlap.
As the video demonstrates, to be able to perfectly recover the original spectrum from the sampled spectrum , the replicated copies must not overlap. We can simply filter out all the copies using an ideal low-pass filter to isolate the original centered at .
Let's look at the boundary between the original spectrum and the first replica (for ):
- The highest frequency of the original spectrum is at .
- The first replica is centered at , so its lowest frequency is at .
For these two not to overlap, we require:
Rearranging this gives the celebrated Nyquist Criterion:
In terms of cyclical frequency (in Hz), where , this is . This confirms Shannon's statement: a band-limited signal can be perfectly reconstructed if the sampling rate is at least twice its highest frequency. The critical rate is what Shannon called the Nyquist rate.
4. The Formal Proof and Reconstruction
We have now derived the theorem intuitively. For completeness, let's look at the formal mathematical proof, which also introduces the ideal reconstruction filter.
Nyquist–Shannon sampling theorem
The Wikipedia article on the sampling theorem provides a concise, formal derivation that mirrors the steps we've taken.
Please read the section 'Derivation as a special case of Poisson summation'. This section shows how to recover the original spectrum X(f) by multiplying the sampled spectrum X_{1/T}(f) by a rectangular function H(f), which represents an ideal low-pass filter. The section culminates in the Whittaker–Shannon interpolation formula, which is the time-domain equivalent of this ideal low-pass filtering.
The reading shows that the process of ideal reconstruction involves filtering with an ideal low-pass filter whose impulse response is a sinc function. This confirms that if the Nyquist criterion is met, the original continuous-time signal is recoverable in its entirety from the samples.
Test your understanding!
A continuous-time signal has a spectrum that is non-zero only in the range . This signal is sampled at a rate of .
- What is the maximum frequency of the signal?
- What is the Nyquist rate for this signal?
- Does the chosen sampling rate satisfy the Nyquist criterion?
- In the spectrum of the sampled signal, where will the centers of the first two positive-frequency replicas of the original spectrum be located?
Show answer
- The maximum frequency is .
- The Nyquist rate is .
- Yes. The sampling rate is greater than the Nyquist rate of 30 kHz.
- The replicas are centered at integer multiples of the sampling frequency. The first positive-frequency replica () is centered at . The second () is centered at .
Conclusion
In this lesson, we have constructed the mathematical foundation of the sampling theorem. By modeling sampling as multiplication by an impulse train, we've seen how this seemingly simple time-domain operation leads to a fundamental and beautiful result in the frequency domain.
Key Takeaways:
- Impulse Sampling Model: Multiplying a signal by an impulse train creates a mathematically tractable model for sampling, .
- Spectral Replication: The Fourier transform of the sampled signal, , is a periodic repetition of the original signal's spectrum, , scaled and shifted by multiples of the sampling frequency .
- The Nyquist Criterion: To enable perfect reconstruction of a signal band-limited to , the spectral replicas must not overlap. This leads to the condition .
- Ideal Reconstruction: If the Nyquist criterion is met, the original signal can be perfectly recovered by passing the impulse-sampled signal through an ideal low-pass filter.
Preview of the Next Lesson:
We have established the condition for perfect sampling. But what happens if we break the rule? In the next lesson, we will analyze the phenomenon of aliasing mathematically and derive the conditions for alias-free signal reconstruction. We will investigate exactly what happens when the spectral replicas overlap and how higher frequencies masquerade as lower frequencies, a critical concept for any practical digital system.