Hello! Welcome to your first lesson in our data science journey. I'm excited to start this path with you.
Our goal in this first module is to strengthen your statistical foundations. While you have some familiarity with statistics, building a rock-solid understanding of the core principles is the most reliable way to set yourself up for success in practical machine learning.
Today, we'll begin with the most fundamental concept in statistical inference: distinguishing between a population and a sample, and between a parameter and a statistic. Everything we do in data science, from analyzing user behavior to training predictive models, is built on this idea. We almost never have data for everyone or everything we're interested in, so we use a smaller piece of it—a sample—to draw conclusions about the whole.
Let's dive in and clarify these essential terms.
1. The Big Picture: Population vs. Sample
First, we need to understand the difference between the entire group we want to study and the smaller group we actually collect data from.
To get a clear and concise introduction to these terms, please watch the first minute and a half of the following video from 365 Data Science.
This video provides a straightforward definition of population, sample, parameter, and statistic, and explains the practical reasons why we work with samples.
Watch from the beginning until timestamp 01:33. Focus on the definitions of population and sample, and the notation used for their sizes (N vs. n).
As the video explained:
- A Population is the entire collection of individuals or items you are interested in. Its size is denoted by . This could be "all undergraduate students in North America," "every Airbnb listing in Vancouver," or "all transactions on an e-commerce site."
- A Sample is a subset of the population that you collect data from. Its size is denoted by . We use samples because collecting data from the entire population is often impractical, too expensive, or impossible.
The key challenge, which we will explore throughout this course, is ensuring that the sample accurately represents the population.
Now, let's watch a segment from another excellent explainer, StatQuest. This will help you visualize what a population looks like and introduce the idea of its underlying characteristics.
Population and Estimated Parameters, Clearly Explained!!!
This StatQuest video uses a great analogy to illustrate what a population distribution is and why we want to understand its characteristics, which are called parameters.
Watch from 00:21 to 07:05. Pay attention to how the histogram of all 240 billion liver cells represents the population, and how the normal distribution curve describes it with a mean and standard deviation.
This video reinforces the idea that the population has a true, underlying distribution and characteristics (like a mean and standard deviation). But since we can't measure all 240 billion cells, we must resort to using a small sample to learn about it.
2. The Numbers: Parameter vs. Statistic
Now we get to the core of today's learning outcome. When we calculate a number like an average or a percentage, the name we give it depends on whether it was calculated from the population or a sample.
- A Parameter is a number that describes a characteristic of the population. Parameters are typically unknown because we rarely have data for the entire population. They are considered fixed values.
- A Statistic is a number that describes a characteristic of a sample. We calculate statistics directly from our data, and we use them to estimate population parameters.
This image from the textbook Data Science: A First Introduction with Python provides a perfect visual summary.
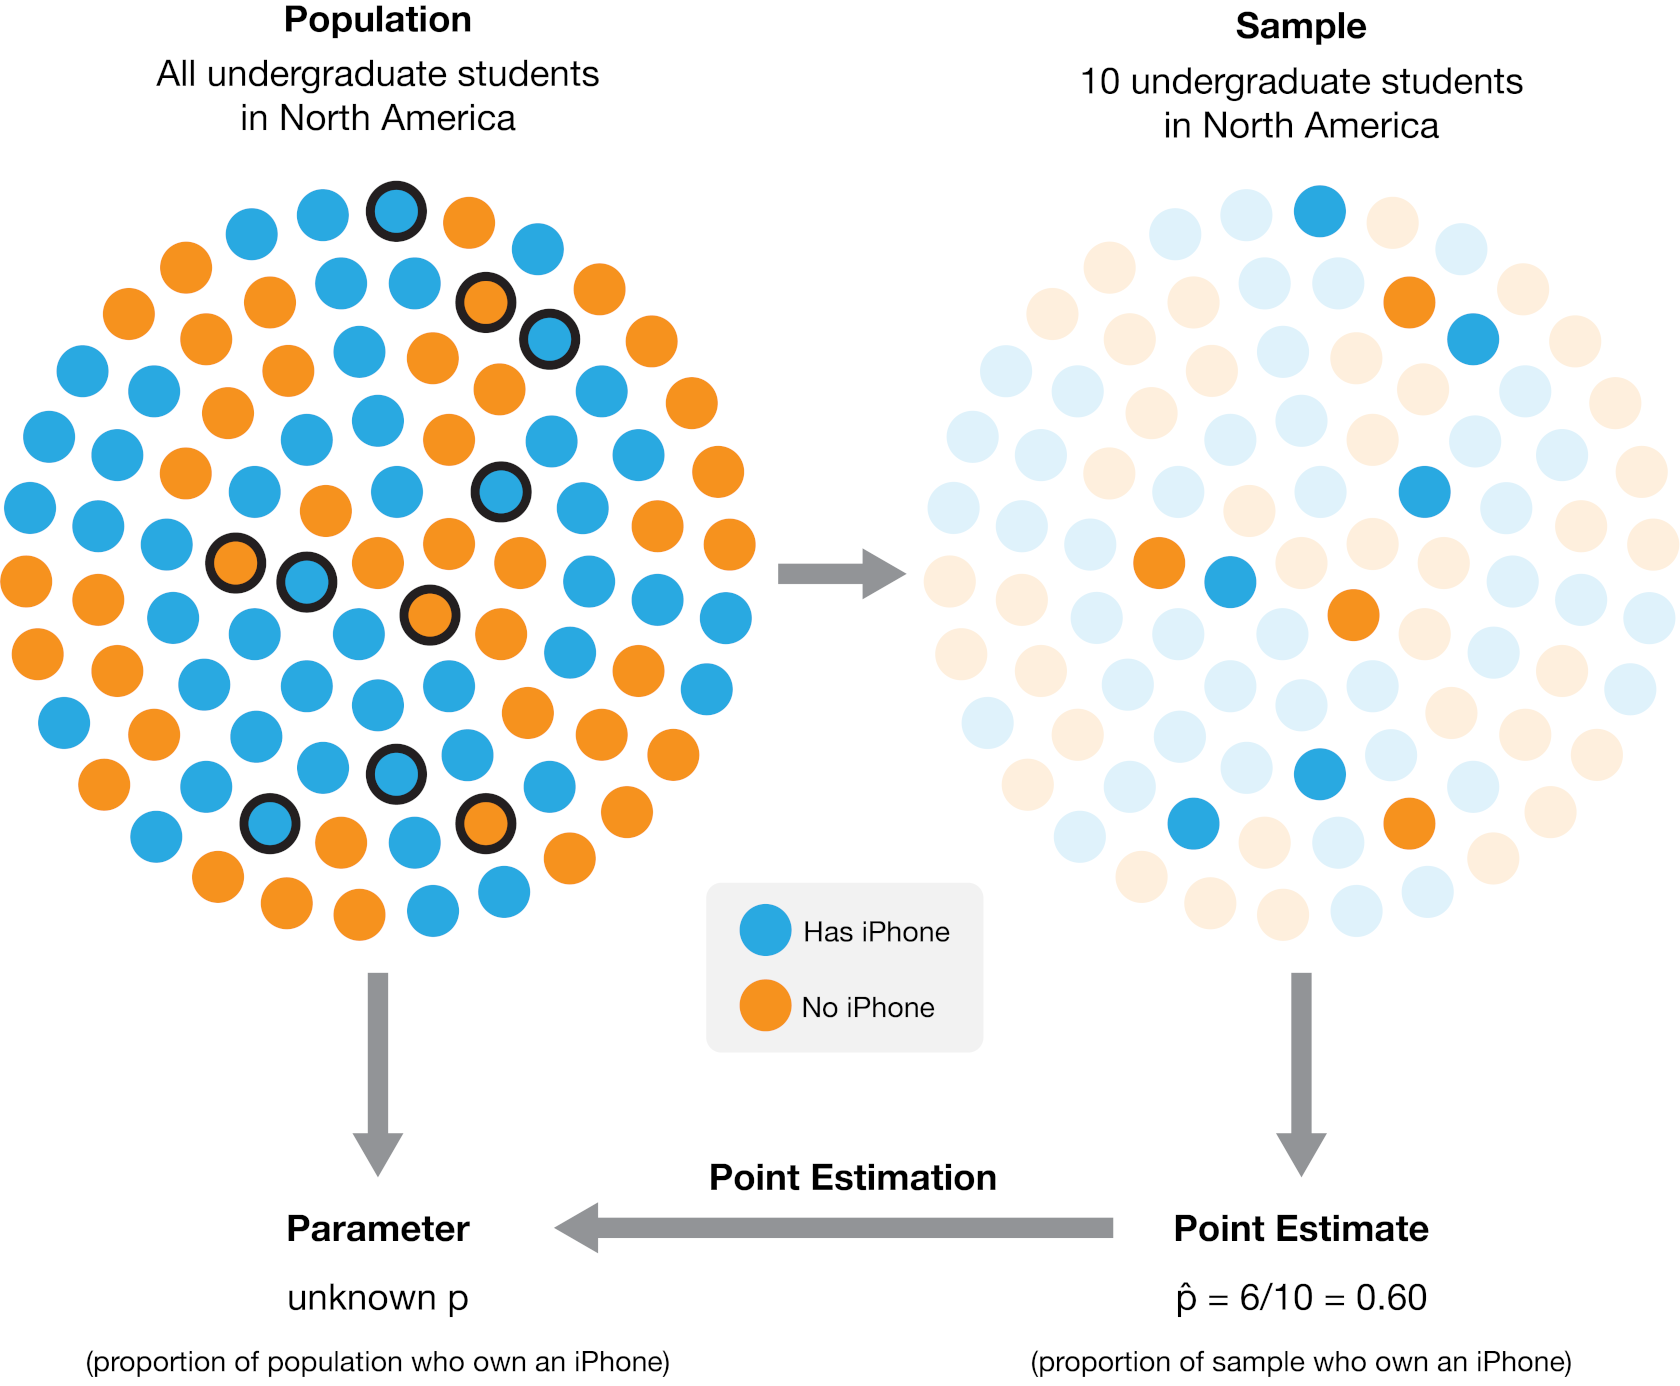
To formalize this, statisticians use specific notation. It's crucial to get comfortable with this, as you'll see it everywhere.
| Characteristic | Population Parameter | Sample Statistic |
|---|---|---|
| Mean | (mu) | (x-bar) |
| Proportion | or (pi) | (p-hat) |
| Standard Deviation | (sigma) |
To see these definitions in context, let's turn to a short reading.
Distinguishing between Population Parameters and Sample Statistics
This article, 'Distinguishing between Population Parameters and Sample Statistics,' clearly defines the terms and introduces the standard notation.
Read the first two main sections, down to just before the table of research questions. Focus on how the text defines parameter and statistic, and the notation used for mean (μ vs. x̄) and proportion (p vs. p̂).
3. A Practical Example in Data Science
Let's connect this to the kind of work you'll be doing. Since you're comfortable with Python and pandas, it's useful to see how these concepts translate to code and data analysis. We'll use a textbook that cleverly uses a full dataset as if it were a population to demonstrate the difference.
10. Statistical inference - Data Science
The textbook 'Data Science: A First Introduction with Python' provides a hands-on view. It treats an Airbnb dataset as a 'population' to show how a sample statistic compares to the true population parameter.
Read sections 10.3 and 10.4. In section 10.3, focus on the iPhone example. In 10.4, pay close attention to the Python code snippets. See how they first calculate the true population proportion and mean from the full airbnb DataFrame. Then, notice how they take a random sample (airbnb.sample(n=40)) and calculate a sample statistic, which is close but not identical to the parameter.
This reading is powerful because it simulates the real-world scenario perfectly. In practice, you would only have the small sample (e.g., 40 listings), and your goal would be to estimate the mean price of all listings. The sample mean of $153.48 is your statistic and your best guess for the unknown population parameter, which in this idealized case we know is $154.51.
The difference between a parameter and a statistic isn't just conceptual; it can even change the formula you use. A classic example is the standard deviation.

4. Check Your Understanding
Let's quickly test your understanding. Based on the definitions, determine whether the number in each sentence refers to a population parameter or a sample statistic.
- A report states that based on a survey of 800 registered voters, 55% plan to vote for the incumbent mayor.
- An internal audit of a company found that of all 1,257 employees, the average number of sick days taken last year was 6.2.
- The Titanic sank in 1912. Of the 2,223 people on board, 31.8% survived.
- A coffee shop wants to know the average temperature of their lattes. They measure 30 lattes and find the average temperature is 155°F.
Think about your answers, then check them against the logic below.
.
.
.
- Answer 1 (Statistic): The 55% is calculated from a survey of 800 voters, not all voters. This is a sample proportion, .
- Answer 2 (Parameter): The average of 6.2 days is based on all 1,257 employees. Since this covers the entire population of interest, it's a population mean, .
- Answer 3 (Parameter): The 31.8% survival rate is calculated from all people on board. This is the complete population, so it's a population proportion, .
- Answer 4 (Statistic): The average of 155°F is from a sample of 30 lattes, not every latte the shop has ever made. It's a sample mean, .
Conclusion
Great job on your first lesson! We've established a critical piece of your data science foundation today.
Here are the key takeaways:
- A population is the entire group of interest, while a sample is a manageable subset of that group.
- A parameter is a numerical value that describes the population (e.g., population mean ). It's a fixed, but usually unknown, target.
- A statistic is a numerical value calculated from a sample (e.g., sample mean ). It's what we can actually compute, and we use it to estimate the parameter.
- The core of statistical inference, and much of machine learning, is about using sample statistics to make intelligent conclusions about population parameters.
Preview of the next lesson:
We've learned that a sample statistic is an estimate, and as the StatQuest video showed, different samples will give you slightly different statistics. This introduces uncertainty. In our next lesson, we will explore confidence intervals, a tool that helps us quantify just how much confidence we can have in our sample statistic as an estimate of the true population parameter.