Hello! Welcome back to your data science journey.
In our last lesson, we learned how to use pair plots and correlation heatmaps to discover relationships between multiple variables. We saw how to visually spot trends, clusters, and correlations. This was about finding the patterns.
Today, we'll focus on the crucial next step: interpreting those patterns to formulate initial hypotheses about a dataset. This is where your role as a data scientist transitions from an observer to an investigator. The goal of EDA isn't just to make plots; it's to generate insightful questions and educated guesses that guide your entire project, from data cleaning to model building.
1. From Observation to Hypothesis
In the context of EDA, a hypothesis is simply a proposed explanation or a testable question based on an observation in your data. It's your "educated guess." It's less about formal statistical testing (like the t-tests we briefly touched on in Module 1) and more about asking "I wonder if..." or stating "It looks like X influences Y."
This process is the intellectual core of data exploration. It's how you turn raw data into a story and a plan of action. The article "Mastering Exploratory Data Analysis (EDA)" frames it perfectly.
Mastering Exploratory Data Analysis (EDA): Everything You Need ...
This article clearly explains the role of EDA in the data science workflow. I'd like you to read a short section that sets the stage for our topic today.
Read the first four paragraphs of the article, starting from 'The journey from raw data...' and ending with '...validating our findings.' Focus on the idea that EDA's purpose is to 'inspire hypothesis generation.'
As the article mentions, EDA allows us to form hypotheses from the data itself. This entire process can be visualized as a clear workflow.
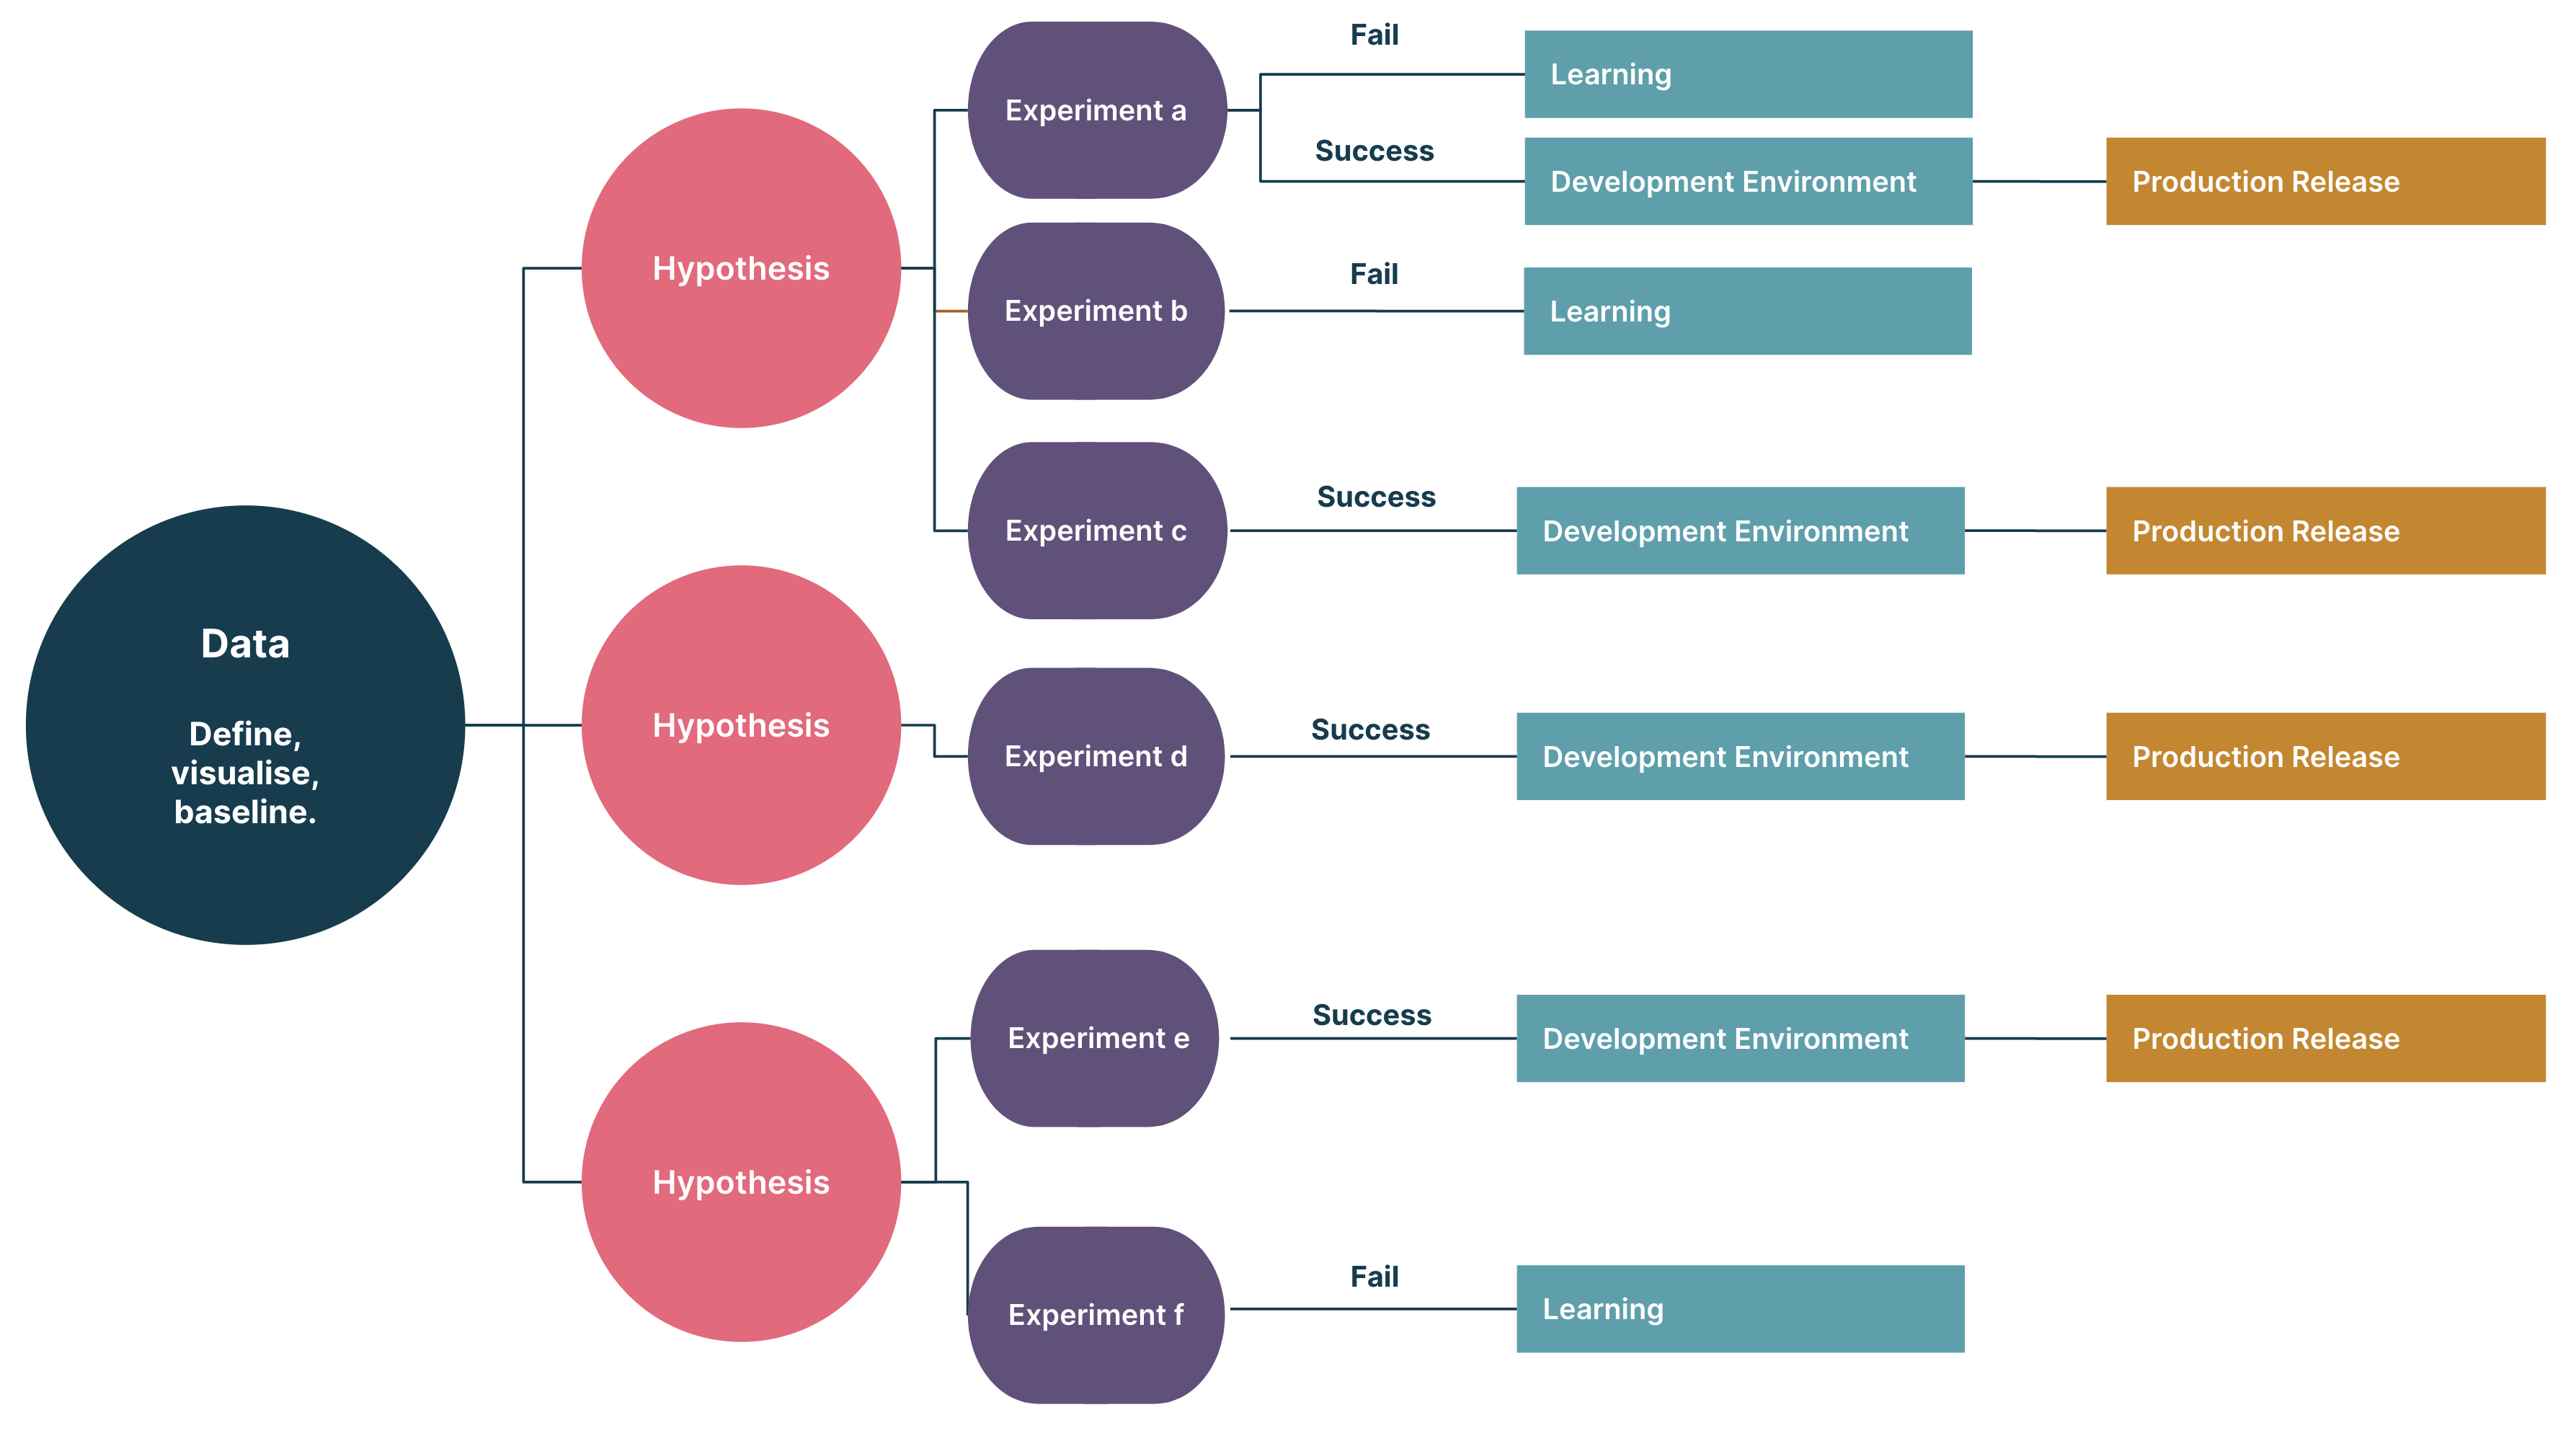
2. Case Study: Formulating and Exploring a Hypothesis
The best way to understand this is to see it in action. Let's imagine we're working with a dataset on world population over several decades. We've already created our heatmaps and seen that the population figures from different years are highly correlated. That's an observation, but it's not very specific.
A more insightful question would be: "Are there certain continents that have grown faster than others?"
This is a perfect example of a hypothesis formulated from EDA. It's specific, it's testable, and it directs our next analytical steps. Let's watch a video where this exact process is demonstrated.
Exploratory Data Analysis in Pandas | Python Pandas Tutorials
In this segment from 'Exploratory Data Analysis in Pandas' by Alex The Analyst, the presenter shows how to move from general exploration to asking and investigating a specific question about the data.
Please watch from 15:03 to 26:33. Pay close attention to these key moments: Framing the Question (15:50): He explicitly states the hypothesis: 'Are there certain continents that have grown faster than others?' Using groupby and mean (17:28): He uses pandas to aggregate the data to the continent level, which is a direct consequence of his question. Transposing and Plotting (22:00 onwards): He manipulates the DataFrame and creates a line plot to visually answer his question.
Deconstructing the Process
What you just saw is a classic EDA workflow for testing a hypothesis:
- Formulate a Question: It started with a clear question about continental growth rates.
- Select & Aggregate Data: The analysis was immediately focused. He used
df.groupby('Continent').mean()to calculate the average population for each continent across the years. This aggregation was necessary to answer the question. - Visualize the Result: A simple table of numbers isn't always clear. By plotting the trends over time, the differences in growth (especially Asia's dramatic increase) became immediately obvious.
Here is a streamlined version of the code from the video that you can run yourself. This demonstrates the core logic of investigating the hypothesis.
import pandas as pd
import matplotlib.pyplot as plt


# We'll use the same dataset from the video.
# You can download it from the video's description or use a similar population dataset.
# For this example, I'll create a simplified DataFrame that captures the essence.


# Sample data structure, replace with actual data loading
data = {
    'Continent': ['Asia', 'Africa', 'Europe', 'North America', 'Asia'],
    '1970 Population': [2134567890, 365022841, 659050212, 329033321, 822534450],
    '2000 Population': [3704288634, 814052381, 725352482, 484393356, 1240644120],
    '2022 Population': [4721999868, 1426736614, 740150930, 600640410, 1425887337]
}
df = pd.DataFrame(data)


# --- Hypothesis Investigation ---
# Hypothesis: Population growth differs significantly across continents.


# 1. Group by continent and calculate the mean population for each year
continent_growth = df.groupby('Continent').mean()


# Select only the population columns
pop_columns = [col for col in continent_growth.columns if 'Population' in col]
continent_growth = continent_growth[pop_columns]


# 2. The DataFrame is currently wide. For plotting, it's better to transpose it.
continent_growth_transposed = continent_growth.transpose()

print("Average Population by Continent (Transposed):")
print(continent_growth_transposed)


# 3. Plot the results
plt.style.use('seaborn-v0_8-whitegrid')
continent_growth_transposed.plot(
    figsize=(12, 7),
    marker='o'
)

plt.title('Average Population Growth by Continent (1970-2022)')
plt.ylabel('Average Population')
plt.xlabel('Year')
plt.xticks(rotation=45)
plt.legend(title='Continent')
plt.show()
3. A Framework for Generating Your Own Hypotheses
You don't need to wait for a stroke of genius. You can systematically generate hypotheses by looking for specific patterns in your EDA visuals.
The article from Hex provides some great examples of this "Visual Question Answering" process.
Exploratory Data Analysis (with examples)
This article, 'Exploratory Data Analysis (with examples),' formalizes the process we've been discussing. It shows how different questions can be answered with different kinds of analysis.
Read the section titled 'Visual Question Answering'. Pay attention to the business questions they pose, such as 'How does Humidity Affect Visit Times?' and 'Which popular venues do people stay at the longest?', and notice how they use specific plots and calculations to investigate them.
Based on everything we've covered, here is a practical framework you can use:
| If you observe... | Ask yourself... | Formulate a hypothesis like... |
|---|---|---|
| A strong correlation (in a heatmap or scatter plot) | "Is this relationship causal or just a coincidence? Does it make logical sense?" | "Feature A has a direct positive/negative impact on the target variable B." |
| A clear difference between groups (in a box plot or colored pair plot) | "Why is this group different? What makes them unique?" | "Customers from region X have a higher average spending than customers from region Y." |
| Distinct clusters of points (in a scatter plot) | "What do the points in each cluster have in common? Can I define these segments?" | "There are two distinct user segments: 'power users' with high engagement and 'casual users' with low engagement." |
| Noticeable outliers (in a box plot or scatter plot) | "Are these data entry errors, or do they represent a rare but real phenomenon?" | "The extreme values in 'transaction amount' are likely fraudulent activities." OR "The outliers in 'response time' are due to system failures." |
| A trend over time (in a line plot) | "What could have caused this increase/decrease? Is it seasonal? Is it a long-term trend?" | "Sales have a seasonal peak in the fourth quarter of every year." |
Conclusion
Today, we bridged the gap between observing patterns and asking meaningful questions. This is arguably the most creative and impactful part of an analyst's job.
Key Takeaways:
- The primary goal of EDA is to inspire and generate hypotheses—educated guesses about your data.
- A good hypothesis is a specific, testable question or statement that guides your next analytical steps.
- The workflow is typically: Observe a pattern -> Formulate a question -> Investigate with targeted code (e.g.,
groupby, filtering, plotting). - You can systematically generate hypotheses by looking for correlations, group differences, clusters, outliers, and trends in your visualizations.
Preview of the next lesson:
We have now covered all the core components of Exploratory Data Analysis, from calculating summary statistics and creating visualizations to formulating hypotheses. In the final lesson of this module, we will learn how to synthesize all these findings into a concise summary, a crucial skill for communicating your insights to colleagues and stakeholders.