Hello! Welcome back to our module on supervised regression.
In our last two lessons, you built a simple linear regression model and learned to evaluate its performance with key metrics like R-squared and RMSE. You can now model the relationship between a single feature and a target, and you can measure how well that model performs.
But what if the price of a house depends on more than just its size? What about the number of bedrooms, the age of the house, or the average income of the neighborhood? To build more powerful and realistic models, we need to incorporate more information.
Today, you will learn to fit a multiple linear regression model and assess the impact of multicollinearity. This involves two key steps:
- Extending linear regression to use multiple independent variables (features).
- Learning to diagnose and handle a common problem called multicollinearity, which can arise when your features are related to each other.
1. From One Feature to Many: Multiple Linear Regression
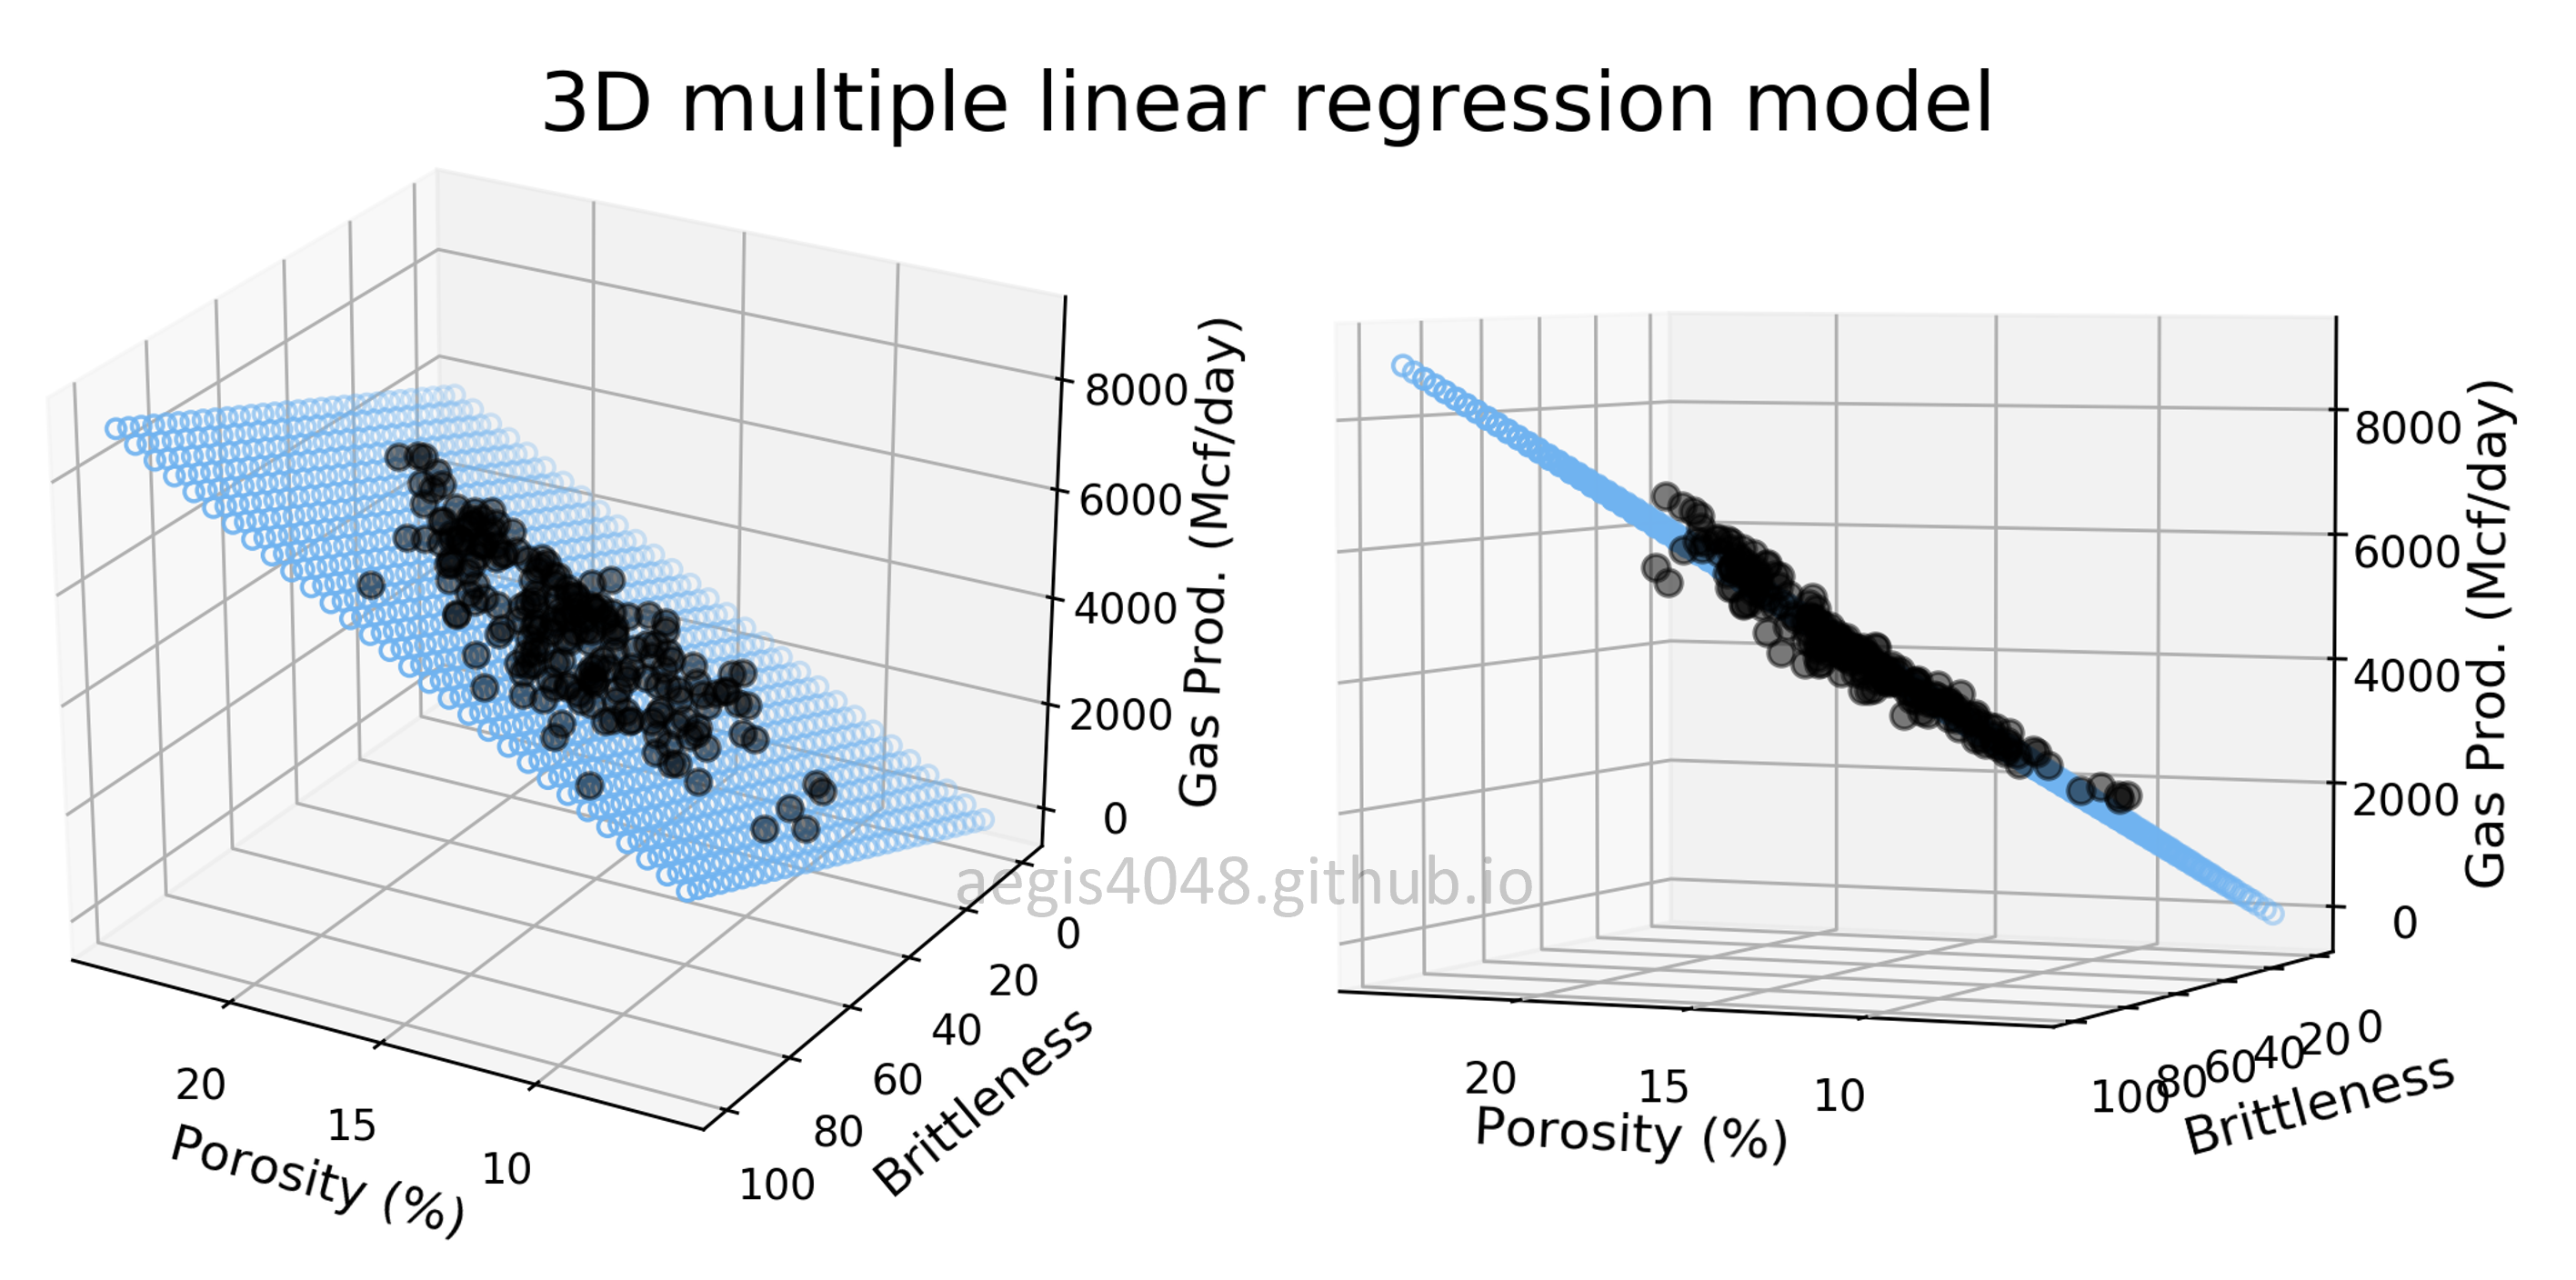
Multiple Linear Regression (MLR) is a natural extension of the simple linear regression you've already learned. Instead of modeling a line, we are now modeling a plane (with two features) or a hyperplane (with more than two features) that best fits the data.
The equation simply expands to include more variables:
- Simple Linear Regression:
- Multiple Linear Regression:
Here, is still the intercept, and are the coefficients for each feature. Each coefficient now represents the change in the target variable for a one-unit change in feature , holding all other features constant.
This image shows what this looks like with two features. The model is no longer a line, but a flat plane slicing through the 3D space of data points.
Let's see how to implement this in Python. The great news is that scikit-learn makes this transition incredibly easy.
Machine Learning Tutorial Python - 3: Linear Regression Multiple Variables
This video from codebasics provides a great practical walkthrough of building a multiple linear regression model in Python. It uses a home prices dataset, similar to our previous examples.
Please watch the following segments: Concept (00:00 - 02:58): Understand how the regression equation is generalized for multiple variables. Model Fitting (06:22 - 07:42): Pay close attention to how the fit method is used. Notice that the X variable now contains multiple columns, but the command model.fit(X, y) remains the same. Interpretation and Prediction (07:42 - 11:14): See how to access the model's coefficients and intercept, and how to use the predict method with new data that has multiple features.
As you saw, the core scikit-learn workflow doesn't change. You prepare your feature matrix X (which now has multiple columns) and your target vector y, and then call model.fit(X, y).
2. The Problem of Redundant Features: Multicollinearity
Now that you can add many features to your model, a new question arises: what happens if the features themselves are correlated? For example, what if we have features for both a person's age and their years of work experience? These two are likely to be highly correlated.
This situation is called multicollinearity, and it can cause problems, particularly with interpreting your model's coefficients.
To build a strong intuition for what multicollinearity is and why it's a problem, the following video offers an excellent deep dive.
What is Multicollinearity? Extensive video + simulation!
This video from zedstatistics explains the concept of multicollinearity, its consequences for your model, and the tools used to detect it.
Watch from the beginning to 11:50. Focus on these key points: The Intuition (00:00 - 03:10): Grasp the core idea using the lawyer's salary example. Why is it hard for the model to separate the effects of age and experience? The Consequences (03:48 - 06:53): Understand what multicollinearity does to your regression results. The key takeaway is that it inflates the standard errors of the coefficients, making them unstable and unreliable. Detection Methods (06:53 - 11:50): Learn about the two main ways to detect multicollinearity: simple correlation checks and the more robust Variance Inflation Factor (VIF).
Key Effects of Multicollinearity:
- Unreliable Coefficients: The coefficient estimates can swing wildly depending on which other variables are in the model. A coefficient might even flip its sign (e.g., from positive to negative) when a correlated feature is added.
- Inflated Standard Errors: This makes it difficult to determine which features are statistically significant. A very important feature might appear insignificant simply because it's correlated with another feature.
- Prediction is Often Unaffected: Importantly, multicollinearity often doesn't hurt the model's overall predictive accuracy. If your only goal is to make predictions, you might not need to worry about it. However, if you want to understand the individual impact of each feature (which is a core part of data science), you must address it.
3. Detecting and Handling Multicollinearity in Python
The most common and robust way to measure multicollinearity is by using the Variance Inflation Factor (VIF).
The VIF for a feature measures how much the variance of its estimated coefficient is increased due to collinearity with other features.

Rules of thumb for interpreting VIF:
- VIF = 1: No correlation.
- 1 < VIF < 5: Moderate correlation, often not a problem.
- VIF > 5 or 10: High correlation, which is likely problematic and should be inspected.
Let's put this into practice. We'll use the California Housing dataset and calculate the VIF for each feature.
Sklearn Linear Regression: A Complete Guide
This guide from DataCamp provides a clear, hands-on example of detecting and dealing with multicollinearity. We will focus on the practical code implementation.
Please read the following two sections from the article: Start at the text 'When multiple features are highly correlated...'. Read this short section to get a definition of VIF and its interpretation thresholds. Next, look at the code block directly under the VIF formula. Study the Python code that first calculates the correlation matrix and then calculates the VIF for each feature using the variance_inflation_factor function from the statsmodels library. Finally, observe the output. Notice how Latitude and Longitude have extremely high VIFs, and AveRooms and AveBedrms are also high. The article then demonstrates the most common solution: removing one of the highly correlated features (AveBedrms) and rerunning the model.
Here's the essential code snippet from the article for calculating VIF. You'll need to have the statsmodels library installed (pip install statsmodels).
import pandas as pd
from sklearn.datasets import fetch_california_housing
from statsmodels.stats.outliers_influence import variance_inflation_factor


# Load the dataset
housing = fetch_california_housing()
X = pd.DataFrame(housing.data, columns=housing.feature_names)


# Calculate VIF for each feature
vif_data = pd.DataFrame()
vif_data["Feature"] = X.columns
vif_data["VIF"] = [variance_inflation_factor(X.values, i) for i in range(X.shape[1])]

print(vif_data)
After running this code, you'd find features with high VIF scores. A common strategy to resolve this is to remove one of the features from a highly correlated pair and then refit the model. For instance, since Latitude and Longitude are highly correlated and provide similar location information, you might decide to keep only one, or create a new feature from them. Similarly, you would likely remove AveBedrms because it is highly correlated with AveRooms.
Conclusion
You've made significant progress today. You've moved beyond simple models and can now leverage multiple features to make predictions, and you're equipped to handle the important challenge of multicollinearity.
Key Takeaways:
- Multiple Linear Regression extends simple linear regression by using multiple features to predict a target variable. The
scikit-learnimplementation remains simple:model.fit(X, y). - Multicollinearity occurs when independent variables in your model are highly correlated with each other.
- This correlation makes it difficult to interpret individual feature coefficients, as their estimates become unstable and standard errors get inflated.
- Variance Inflation Factor (VIF) is the standard method for detecting multicollinearity. A VIF value above 5 or 10 is a red flag.
- The most common way to handle multicollinearity is to remove one of the highly correlated features and refit the model.
Preview of the next lesson:
Our linear models have so far assumed a straight-line (or flat-plane) relationship between features and the target. But what if the relationship is curved? In our next lesson, you will learn to implement polynomial regression to model these non-linear relationships, giving you another powerful tool for your modeling toolkit.