Hello! Let's dive into the next lesson in our "Model Tuning and Selection" module.
In our last session, you learned how to use ROC curves and AUC scores to compare classification models. This was a big step up from just using accuracy. However, we performed that comparison on a single train-test split. The results you get from one split can sometimes be misleadingly high or low, just by the luck of the draw.
Today, we'll address this by tackling the learning outcome: Systematically compare multiple models using cross-validated metrics. You will learn how to build a robust "test harness" that gives you a much more reliable estimate of how your models will perform on unseen data. This is a standard and essential practice for any data scientist.
1. The Flaw in a Single Split
As a quick recap, when you use train_test_split once, the performance metric you calculate (be it accuracy, AUC, etc.) is highly dependent on which specific data points ended up in your test set. It's a "high-variance estimate"—if you were to re-run the split with a different random_state, you would likely get a different score.
This is like testing a student's math skills. If you give them a single 10-question test, their score might depend on whether those 10 questions happened to cover topics they were strong or weak in. A much better approach is to give them several different tests and average their scores to get a more stable measure of their ability. This is the core idea behind cross-validation.
The video below gives a great intuitive explanation of this problem and introduces K-Fold cross-validation as the solution.
Selecting the best model in scikit-learn using cross-validation
To understand why we need a more robust method than a single train-test split, watch this short introductory segment from the 'Selecting the best model...' video by Data School.
Watch from 2:50 to 7:40. Pay attention to how changing the random_state in train_test_split changes the accuracy, and how the video then introduces k-fold cross-validation as a way to get a more stable performance estimate.
2. The K-Fold Cross-Validation Process
In K-Fold cross-validation, instead of one split, we make multiple. The process is:
- Split Data: The training data is divided into 'k' equal-sized parts, or "folds". A common choice for k is 5 or 10.
- Iterate: We run a loop 'k' times. In each iteration:
- A different fold is chosen as the validation set.
- The remaining k-1 folds are used as the training set.
- The model is trained on the training set and evaluated on the validation set. The evaluation score is recorded.
- Aggregate: After 'k' iterations, we have 'k' performance scores. The final performance estimate is the average of these 'k' scores.
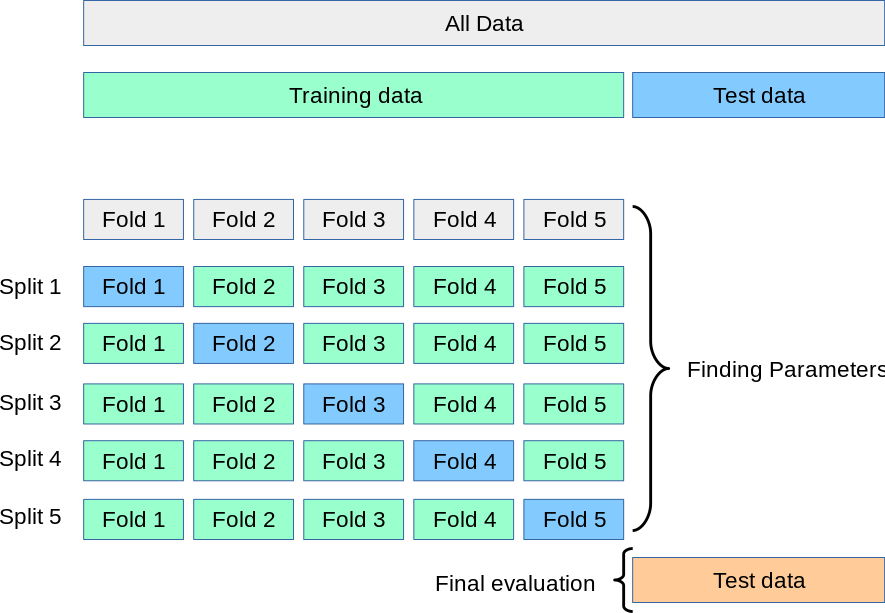
3. Comparing Models with cross_val_score
Scikit-learn makes this process incredibly simple with the cross_val_score function. It handles the entire k-fold iteration process for you in a single line of code.
The function returns an array of scores, one for each fold. We can then calculate the mean and standard deviation to summarize the model's performance.
Let's see how to use it to compare two models you're familiar with: Logistic Regression and K-Nearest Neighbors.
Selecting the best model in scikit-learn using cross-validation
This clip from the Data School video demonstrates exactly how to use cross_val_score to compare the performance of two different models.
Watch from 22:23 to 24:06. Notice how cross_val_score is called for both the KNN and Logistic Regression models, and how their mean scores are used to determine which is likely better.
A key takeaway is that when you compare models this way, you are more confident in your conclusion because it's based on an average performance across multiple different data splits, not just one.
4. Building a Systematic Test Harness
Now, let's put this into a systematic framework. When comparing several candidate models, it is crucial to ensure that every model is evaluated in exactly the same way. This means using the same dataset and, importantly, the same cross-validation splits.
We can build a reusable "test harness" to do this. This involves:
- Creating a list of the models we want to compare.
- Defining a consistent cross-validation strategy (e.g., 10-fold CV with a fixed random seed).
- Looping through the models, running
cross_val_scorefor each, and collecting the results. - Presenting the results, both numerically and visually.
The following article from Machine Learning Mastery provides a perfect template for this process.
How To Compare Machine Learning Algorithms in Python with scikit-learn
This article, 'How To Compare Machine Learning Algorithms in Python with scikit-learn', provides a fantastic, practical code recipe for building a model comparison test harness.
Please read the sections 'Compare Machine Learning Algorithms Consistently', the Python code block that follows, and the interpretation of the results. Focus on: How a list of models is created. How the KFold object is configured with a random_state to ensure all models use the same splits. How the code loops through the models and collects the results from cross_val_score. How a box plot is used to visually compare the score distributions.
A Practical Example
Let's adapt the code from the article to our own example. Here's how you can create a test harness to compare Logistic Regression, KNN, and a Decision Tree classifier.
import pandas as pd
import matplotlib.pyplot as plt
from sklearn.model_selection import KFold, cross_val_score
from sklearn.linear_model import LogisticRegression
from sklearn.tree import DecisionTreeClassifier
from sklearn.neighbors import KNeighborsClassifier
from sklearn.datasets import make_classification


# 1. Load Data
X, y = make_classification(n_samples=1000, n_features=20, n_informative=5, n_redundant=15, n_classes=2, random_state=42)


# 2. Prepare models
models = []
models.append(('LR', LogisticRegression(solver='liblinear')))
models.append(('KNN', KNeighborsClassifier()))
models.append(('CART', DecisionTreeClassifier()))


# 3. Evaluate each model in turn
results = []
names = []
scoring = 'accuracy' # We could also use 'roc_auc', 'f1', etc.

print("Cross-validated performance:")
for name, model in models:


    # Use StratifiedKFold for classification for more reliable results, especially with imbalanced data.
    # It ensures class proportions are the same in each fold.
    kfold = KFold(n_splits=10, random_state=42, shuffle=True)
    cv_results = cross_val_score(model, X, y, cv=kfold, scoring=scoring)
    results.append(cv_results)
    names.append(name)
    msg = f"{name}: {cv_results.mean():.4f} ({cv_results.std():.4f})"
    print(msg)


# 4. Visualize the comparison with a box plot
fig = plt.figure(figsize=(8,6))
fig.suptitle('Algorithm Comparison')
ax = fig.add_subplot(111)
plt.boxplot(results)
ax.set_xticklabels(names)
plt.ylabel(f'{scoring.capitalize()} Score')
plt.show()
When you run this code, you'll get two things:
- A numerical summary showing the mean and standard deviation of the accuracy for each model.
- A box plot that visualizes the distribution of the 10 accuracy scores for each model.
Interpreting the Box Plot:
- The line in the middle of the box is the median score.
- The box itself represents the interquartile range (IQR)—the middle 50% of scores.
- The "whiskers" show the range of the scores.
- A better model will generally have a distribution that is higher up on the plot (higher scores) and a smaller box (more consistent performance).
Conclusion
You now have a powerful and reliable method for comparing machine learning models. Moving from a single train-test split to cross-validation is a critical step toward building robust and trustworthy models.
Key Takeaways:
- A single train-test split provides a high-variance estimate of model performance.
- K-Fold Cross-Validation provides a more robust performance estimate by training and testing the model on multiple different splits of the data and averaging the results.
- The
cross_val_scorefunction in scikit-learn is the easiest way to perform cross-validation. - To compare models fairly, you must build a test harness that evaluates each model using the exact same cross-validation splits.
- Box plots are an excellent way to visualize and compare the distribution of cross-validated scores for multiple models.
Preview of the next lesson:
You've tuned hyperparameters, you've learned how to compare models using ROC/AUC, and now you can produce robust, cross-validated performance metrics. The final step in this module is to put it all together. In the next lesson, you will learn how to select a final model and justify the choice based on performance and project goals, formalizing the decision-making process.