Hello! Welcome back to our module on the Fundamentals of Model Validation.
In our last lesson, we mastered k-fold cross-validation, a robust technique for estimating a model's performance on unseen data. We saw that by averaging performance across multiple "folds," we get a much more reliable score than a single train-validation split can provide. These reliable training and validation scores are not just for reporting; they are powerful diagnostic tools.
Today, we'll learn what to diagnose. Your learning outcome is to define bias and variance and their relationship to underfitting and overfitting. These concepts are the bedrock of machine learning diagnostics. Understanding them is crucial for moving from simply building models to building models that generalize well to solve real-world problems.
1. The Core Problem: Simple vs. Complex Models
Imagine you're trying to model a real-world relationship, which is almost never a perfect straight line. How complex should your model be? Should it be a simple, straight line that captures the general trend, or a highly flexible, squiggly line that tries to hit every single data point?
This is the central question we'll explore. Let's start with a fantastic video that provides a clear, intuitive explanation using a simple example.
Machine Learning Fundamentals: Bias and Variance
The video 'Machine Learning Fundamentals: Bias and Variance' from StatQuest with Josh Starmer provides an excellent visual introduction to the challenge. It compares a simple linear model with a very flexible 'squiggly' model to predict mouse height from weight.
Please watch from the beginning to 05:33. As you watch, focus on these two key ideas: Why does the simple straight line fail to capture the true relationship in the data? Why does the complex squiggly line fit the training data perfectly but fail miserably on the testing data?
As the video illustrates, there are two fundamental ways a model can be wrong:
- The model is too simple and fails to capture the underlying pattern in the data. The straight line couldn't model the curve. This type of error is related to bias.
- The model is too complex and learns the noise in the training data, not just the signal. The squiggly line fit the training points perfectly but was a poor predictor for new data. This type of error is related to variance.
2. Defining Underfitting, Overfitting, Bias, and Variance
Let's formalize the concepts from the video. The two failure modes we saw are called underfitting and overfitting.
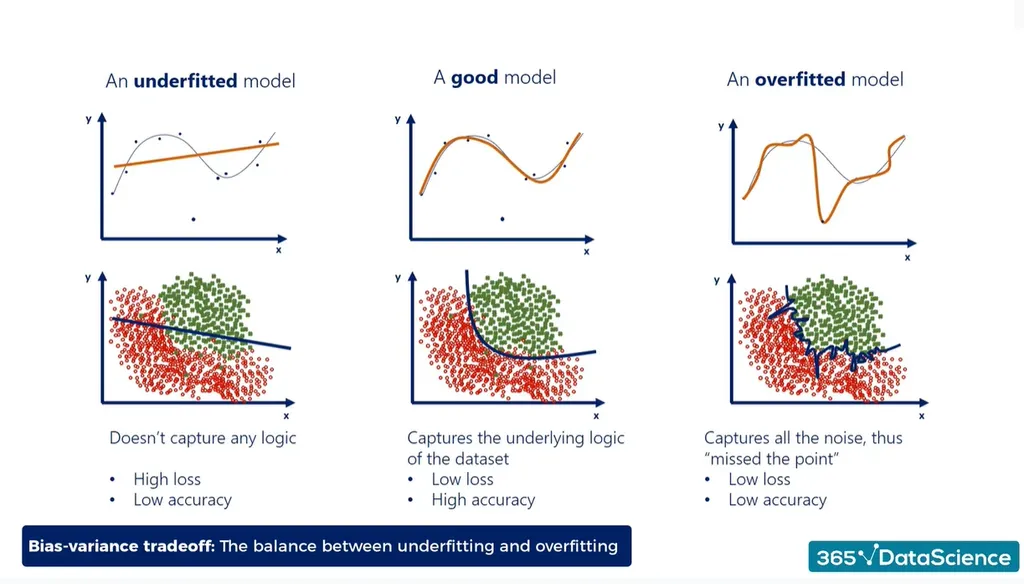
Now, let's connect these practical problems to the theoretical concepts of bias and variance.
-
Bias is the error introduced by approximating a real-world problem, which may be complicated, by a model that is too simple. A model with high bias pays little attention to the training data and oversimplifies the true relationship, leading to high error on both training and test data. This is underfitting.
- Symptom: Your model performs poorly on the training set. If it can't even get the training data right, it's not going to do well on new data.
-
Variance is the error introduced because a model is too sensitive to the specific training data it saw. A model with high variance pays too much attention to the training data, capturing not only the underlying patterns but also the random noise. It performs extremely well on the training data but fails to generalize to new, unseen data. This is overfitting.
- Symptom: Your model performs very well on the training set, but poorly on the validation/test set. There is a large gap between training and validation performance.
The following video provides another excellent walkthrough, using the practical lens of training error and test error to define these terms.
Machine Learning-Bias And Variance In Depth Intuition| Overfitting Underfitting
In this video, 'Machine Learning-Bias And Variance In Depth Intuition' by Krish Naik, he uses a polynomial regression example to show how increasing model complexity affects performance and directly links this to bias and variance.
Please watch from 00:36 to 07:21. Pay close attention to how he defines underfitting, overfitting, bias, and variance using training accuracy/error and test accuracy/error. This practical definition is extremely useful in your day-to-day work.
To summarize the relationship between these concepts, here is a helpful table based on the diagnostics you've just seen:
| Scenario | Model Behavior | Training Error | Validation/Test Error | Diagnosis |
|---|---|---|---|---|
| Underfitting | Too simple | High | High | High Bias |
| Overfitting | Too complex | Very Low | High (large gap from train) | High Variance |
| Good Fit | Balanced | Low | Low (and close to train) | Low Bias, Low Variance |
3. The Bias-Variance Tradeoff
You might be thinking: "Great, I'll just aim for low bias and low variance." The challenge is that these two goals are often in conflict. This is known as the bias-variance tradeoff.
- Decreasing a model's bias (by making it more complex) almost always increases its variance.
- Decreasing a model's variance (by making it simpler) almost always increases its bias.
Our goal is not to eliminate one or the other, but to find the "sweet spot" of model complexity that minimizes the total error on unseen data.

The total error of a model can be thought of as:
The irreducible error is due to inherent noise in the data itself. We can't eliminate it, but we can manage bias and variance through model selection and tuning.
Let's ground this with a concrete, practical guide. The following article walks through an example using a golf course dataset and shows how changing a model's complexity (the depth of a decision tree) affects the training and test errors, perfectly illustrating the tradeoff.
Bias-Variance Tradeoff, Explained: A Visual Guide with Code ...
The article 'Bias-Variance Tradeoff, Explained' provides a step-by-step example with code snippets and clear explanations. It will solidify your understanding of how to identify these issues by looking at performance metrics.
Please read the sections 'Understanding Bias (When Models Underfit)', 'Understanding Variance (When Models Overfit)', 'Finding the Balance', and 'Key Takeaways'. Focus on the table that shows Training and Test RMSE as the model depth increases. This is a perfect example of the tradeoff in action.
The article's "Key Takeaways" section provides a crisp summary for spotting these issues, which is an essential practical skill. When you see a high training error, you should immediately think "potential high bias/underfitting." When you see a low training error but a much higher validation error, you should think "potential high variance/overfitting."
Conclusion
In this lesson, you've learned to define and identify some of the most fundamental concepts in model building. This knowledge forms the theoretical basis for diagnosing and improving your machine learning models.
Key Takeaways:
- Bias is error from a model being too simple (wrong assumptions). It causes underfitting. The key symptom is high training error and high validation error.
- Variance is error from a model being too complex and sensitive to noise in the training data. It causes overfitting. The key symptom is a large gap between a very low training error and a much higher validation error.
- The Bias-Variance Tradeoff describes the inverse relationship between bias and variance. As you increase model complexity, bias tends to decrease while variance tends to increase.
- The goal is to find a model that is complex enough to capture the true patterns (low bias) but not so complex that it models the noise (low variance), achieving the lowest possible total error on unseen data.
Preview of the next lesson:
Now that you can define these concepts and spot their symptoms by looking at training and validation scores, how can you visualize this process more systematically? In our next lesson, you will learn to plot and interpret learning curves, a powerful diagnostic tool that shows how a model's performance changes as it sees more data, providing clear visual evidence of bias and variance issues.