Hello! Welcome back to our module on unsupervised learning.
In our last lesson, we explored K-Means clustering and saw how it can uncover interesting groups in data, like customer segments. However, we had to make an educated guess for the most important hyperparameter: the number of clusters, K. In real-world data science, relying on a guess isn't robust.
This lesson directly addresses that challenge. We'll explore two powerful, data-driven techniques to determine the optimal number of clusters for K-Means. By the end of this 60-minute lesson, you will be able to use the elbow method and silhouette score to select the optimal number of clusters. This will elevate your clustering analysis from a subjective exercise to a systematic, justifiable process.
1. The Elbow Method: Finding the Point of Diminishing Returns
The first technique, the Elbow Method, is based on a simple, intuitive idea. As you increase the number of clusters (K), the clusters will naturally get smaller and tighter. This means the total error, or inertia, will decrease.
Inertia, also known as the Within-Cluster Sum of Squares (WSS), is the sum of the squared distances of samples to their closest cluster center. It's the same metric K-Means tries to minimize.
While lower inertia is better, adding more clusters always reduces it. If we have as many clusters as data points, the inertia becomes zero! This is a form of overfitting. We're looking for the "sweet spot" where adding another cluster doesn't provide a significant reduction in inertia anymore. This point on the graph of Inertia vs. K is called the elbow point.
To get a clear visual and conceptual understanding of this, please watch the first part of the following video.
Determine the right Number of Clusters | WSS | Elbow Method | Silhouette Score | Data Science
This video from Six Sigma Pro SMART provides an excellent conceptual breakdown of the Elbow Method using Within Sum of Squares (WSS).
Watch from the beginning to 05:30. Focus on: What Within Sum of Squares (WSS) represents. Why WSS always decreases as you increase the number of clusters (K). How to identify the 'elbow point' on the plot, which signifies the optimal K.
The plot you saw in the video is a classic elbow plot. The ideal number of clusters is at the "elbow" of the curve, where the rate of decrease sharply changes.

A key limitation of the elbow method is that the "elbow" can sometimes be ambiguous or difficult to spot, especially with complex datasets. This is why we need a second, often more decisive, method.
2. The Silhouette Score: Measuring Cohesion and Separation
The Silhouette Score offers a more sophisticated approach. Instead of just looking at how compact the clusters are (cohesion), it also measures how well-separated they are from each other (separation).
For each data point, a silhouette score is calculated based on two values:
a: The mean distance between the data point and all other points in the same cluster. This measures cohesion. A small value ofais desirable.b: The mean distance between the data point and all points in the next nearest cluster. This measures separation. A large value ofbis desirable.
The silhouette score for a single data point is then calculated as:
To get the full picture, we calculate the average silhouette score across all data points in the dataset.
Elbows and Silhouettes: Hands-on Customer Segmentation in Python
The following article gives a clear definition of the silhouette score and its components. Understanding this will help you interpret the results correctly.
Please read the first five paragraphs of the section titled '4.4 Number of Clusters: Searching for the Maximum Silhouette'. Focus on understanding: The formula: (b – a) / max(a , b). The definitions of a (cohesion) and b (separation). The score range (-1 to +1) and what high, low, and negative values signify.
Interpreting the Silhouette Score:
- A score near +1 indicates that the sample is far away from the neighboring clusters (good separation) and close to the points in its own cluster (good cohesion). This is the ideal.
- A score of 0 indicates that the sample is on or very close to the decision boundary between two neighboring clusters.
- A score near -1 indicates that the sample may have been assigned to the wrong cluster.
Unlike the elbow method, where we look for an inflection point, with the silhouette score, our goal is simple: the K that yields the highest average silhouette score is considered the optimal number of clusters.
3. Practical Implementation in Python
Now let's see how to implement both methods in Python. You'll run K-Means in a loop for a range of K values and store the inertia and silhouette score for each run.
The following comprehensive guide provides clear, practical code for doing exactly this.
K-Means Clustering in Python: A Practical Guide
This guide from Real Python, 'K-Means Clustering in Python: A Practical Guide', contains excellent, copy-paste-ready code for implementing both the elbow method and the silhouette analysis.
Please read the entire section 'Choosing the Appropriate Number of Clusters'. Pay close attention to: The Elbow Method Code: How a for loop is used to iterate through different values of k and append the kmeans.inertia_ to a list. The Silhouette Coefficient Code: The similar loop structure used to calculate the silhouette_score for each k. The Resulting Plots: Observe how the plots for both SSE (inertia) and the silhouette coefficient help in choosing the optimal k (3 in their example).
For a video-based walkthrough that combines these concepts into a single coding session, the following resource is excellent. It will show you how to generate data, loop through cluster numbers, and plot both inertia and silhouette scores to make a decision.
Finding The Optimal Number of Clusters in Machine Learning
This video from NeuralNine, 'Finding The Optimal Number of Clusters in Machine Learning', provides a full Python walkthrough of everything we've discussed.
Watch the segment from 08:15 to 15:11. This will consolidate your learning by showing you: How to code the loop to calculate inertia for different K and plot the elbow curve. How to add the silhouette score calculation to the same loop. How to plot the silhouette scores and find the peak, which corresponds to the best K.
4. Combining the Methods for a Robust Decision
In practice, you should use both the elbow method and the silhouette score as complementary tools. Plotting both results can give you a more confident answer.
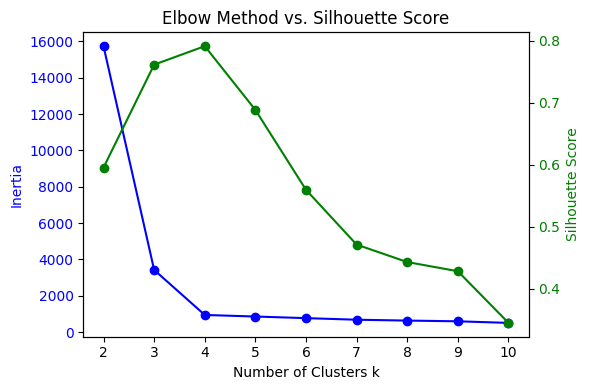
By evaluating both metrics, you can make a well-rounded and justifiable decision on the best K for your model.
Conclusion
You now have a systematic framework for one of the most important decisions in K-Means clustering. Instead of guessing, you can use quantitative evidence to guide your choice of K.
Key Takeaways:
- Choosing the right number of clusters (
K) is a critical step for building a meaningful K-Means model. - The Elbow Method finds the optimal
Kby identifying the "elbow point" in the inertia plot, which represents the point of diminishing returns. - The Silhouette Score provides a more robust measure by evaluating both cluster cohesion (how tight clusters are) and separation (how distinct they are from each other). The optimal
Kis the one that maximizes this score. - Using both methods together provides a strong, data-driven justification for your choice of
K.
Preview of the next lesson:
While K-Means is powerful, it requires us to specify K upfront. What if we don't want to? In our next lesson, we will explore hierarchical clustering, an alternative method that doesn't require pre-specifying the number of clusters. Instead, it builds a tree-like structure of nested clusters, which we can visualize using a diagram called a dendrogram.