Welcome to the final lesson of your course! In our last session, you successfully deployed your full-stack application and configured Cross-Origin Resource Sharing (CORS) to allow your frontend and backend to communicate in a production environment. Your application is now live on the internet—a massive achievement.
However, deployment is not the end of the story. An application that works perfectly on your local machine can sometimes behave unexpectedly in production. This is usually due to subtle differences between your development and production environments.
This lesson addresses the crucial final step in the development lifecycle: testing the deployed application and debugging common deployment issues. We will establish a systematic workflow for troubleshooting, explore the most common errors you'll encounter, and learn how to interpret the clues provided by logs and developer tools. Mastering this skill is what separates a good developer from a great one, ensuring your applications are not only built but are also reliable and maintainable.
The Golden Rule of Debugging: Always Check the Logs
When something goes wrong with your deployed application, your first and most important action is to check the logs. Logs are a chronological record of events, errors, and activities generated by your application and the platform hosting it. They are your primary source of truth for what's happening under the hood.
On a platform like Render, you will encounter two main types of logs:
- Deploy Logs: These show the output of your build command (e.g.,
npm install) and start command (e.g.,npm start). If your application fails to build or start, the error will be here. - Runtime Logs: These show the live activity of your running application, including incoming API requests,
console.logstatements, and, most importantly, any errors or crashes that occur while the app is in use.
The Render documentation provides a clear overview of how to access and interpret logs on the platform. Understanding this is your first line of defense when debugging.
Read the introduction and the section titled "1. Check the logs." Focus on where to find the deploy logs (in the 'Events' feed) and the runtime logs (on the 'Logs' page). Notice the tip about searching for the word error—this is a simple but powerful technique.
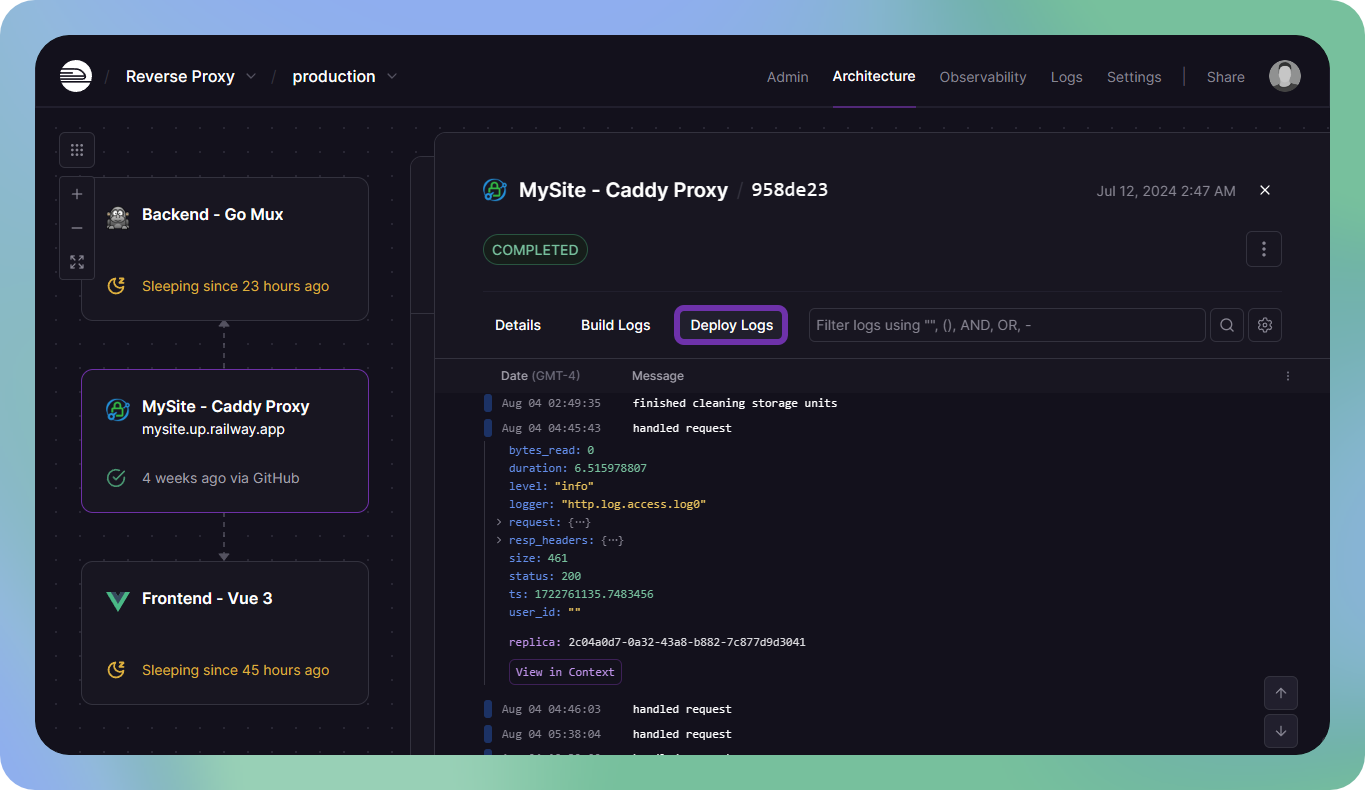
The logs provide a detailed narrative. The images below show examples of log outputs from a similar platform, giving you a sense of what to look for: status codes, request paths, and error messages.

A Systematic Debugging Workflow
When a user reports a bug or you notice something isn't working on your live site, avoid randomly changing code. Instead, follow a structured process to pinpoint the issue.
- Reproduce the bug while keeping your browser's Developer Tools open.
- Check the Browser Console: Look for any red error messages. Frontend JavaScript errors often appear here.
- Check the Browser Network Tab: This is the most critical step for full-stack issues. Find the specific API request that failed. What was its HTTP status code (e.g., 404, 500)? What did the response body say?
- Check the Backend Logs: If the Network tab points to a server-side problem (a 5xx error, or an unexpected 4xx error), the backend's runtime logs are your next destination. The logs will contain the specific error message and stack trace that caused the server to fail.
This video demonstrates this exact workflow in a practical scenario, moving from a frontend observation to a backend fix.
How I debug full stack applications
The video "How I debug full stack applications" by Web Dev Cody provides an excellent, real-world demonstration of this troubleshooting process.
Watch the following segments to see a complete debugging cycle: 01:09 - 02:10: See how to use the browser's Network Tab to identify a 404 Not Found error from the backend. 02:10 - 04:50: Follow along as the problem is isolated on the backend using an API client (like Postman or Thunder Client) and the VS Code debugger to find and fix a bug related to an unhandled promise. 09:22 - 12:20: The focus shifts back to the frontend to correctly handle the API's error response. This highlights how fetch handles non-200 status codes and reinforces the power of console.log for debugging.
A Field Guide to Common Deployment Issues
Now that you have a workflow, let's look at a checklist of common problems. Think of this as a "field guide" that connects symptoms to their likely causes.
1. Build & Deploy Failures
These errors occur when your application can't even start on the deployment platform.
-
Symptom: The deploy fails during the "build" step.
-
Common Causes:
Module Not Found: A dependency is missing frompackage.json, or you're referencing a file with incorrect capitalization. (Your local machine might be case-insensitive, but the Linux servers used for deployment are not!).- Version Mismatches: Your code uses a newer JavaScript feature that isn't supported by the Node.js version on the server. You can usually specify the Node.js version in your platform's settings.
- Invalid Build Command: The build command in your service's settings is incorrect (e.g., a typo in
npm run build).
-
Symptom: The build succeeds, but the application crashes immediately on startup.
-
Common Causes:
- Missing Environment Variables: Your code is trying to access
process.env.DATABASE_URLorprocess.env.JWT_SECRET, but it wasn't set in the production environment. The application will crash because the variable isundefined. - Port Binding Issues (
502 Bad Gateway): Your Express server isn't listening on the correct host and port. In production, you must bind to0.0.0.0and use the port provided by thePORTenvironment variable (e.g.,const PORT = process.env.PORT || 3001;).
- Missing Environment Variables: Your code is trying to access
The Render troubleshooting guide catalogs these common build and runtime errors with concise explanations.
Skim through section "2. Ensure matching versions and configuration" and read section "Common errors" more closely. Don't memorize everything, but get familiar with the types of problems listed, like version conflicts and invalid commands.
2. Database Connection Errors
These are among the most frequent runtime issues. Your API endpoints will likely return 500 Internal Server Error and your logs will contain specific database error messages.
- Symptom: API requests that interact with the database fail. Logs show errors like "Connection refused" or "database does not exist."
- Common Causes & Solutions:
Connection refused: This often points to a firewall or network access issue. For a cloud database like Neon, this means your backend server's IP address has not been added to the database's IP allow list.Database "X" Does Not Exist: Usually a simple typo in the database name within yourDATABASE_URLenvironment variable.FATAL: password authentication failed for user "X": The username or password in yourDATABASE_URLis incorrect.Sorry, Too Many Clients Already: Your application is opening more connections to the database than the allowed limit. This can be a sign of a "connection leak" (not closing connections properly) or that your application traffic is exceeding your database plan's capacity. The long-term solution is often to implement a connection pool.
5 Common Connection Errors in PostgreSQL and How to Solve Them
This article from Tiger Data provides an excellent breakdown of the most common PostgreSQL connection errors and how to solve them.
Read the sections titled "Sorry, Too Many Clients Already," "Connection to Server Failed: Connection Refused," and "Database 'X' Does Not Exist." These three cover the most probable database issues you'll face with a deployed application.
Test your understanding!
Your deployed app's login page works, but when you try to view your to-do list, you get a generic "Error loading data" message. The browser's Network tab shows a 500 Internal Server Error for the /api/todos request. What is your immediate next step, and where would you look for the answer?
Show answer
The immediate next step is to check the backend service's runtime logs on your deployment platform (e.g., Render). A 500 error code signifies an unhandled exception or crash on the server. The logs are the only place you will find the specific error message (e.g., "could not connect to database," "jwt malformed," etc.) and the stack trace pointing to the line of code that failed.
Conclusion and Final Words
Congratulations on completing the final lesson! You have now navigated the full lifecycle of a web application—from foundational JavaScript concepts to building a full-stack application and deploying it for the world to see.
Key Takeaways from this Lesson:
- A systematic debugging process (Browser Console -> Network Tab -> Server Logs) is essential for quickly finding the root cause of an issue.
- Logs are your most valuable tool. Learn to love them.
- Most deployment issues arise from environmental differences. Double-check your environment variables, Node.js versions, and build configurations.
- Familiarize yourself with common error categories like build failures, database connection issues, and API status codes (
4xx/5xx) to diagnose problems faster.
You have successfully acquired the core skills needed for a modern Web Developer or Software Engineer role. The journey, however, doesn't end here. The best way to solidify your knowledge and grow is to keep building. Take what you've learned and apply it to a new project of your own. Explore new libraries, contribute to an open-source project, and stay curious.
You've built a fantastic foundation. We wish you the very best in your career and future projects