Welcome! In our previous lessons, we've systematically broken down the different types of visuals in Writing Task 1, from describing trends in dynamic charts and proportions in static charts to outlining the steps in a process diagram. You've developed a toolkit of vocabulary and grammatical structures for each.
Today, we bring all those pieces together. Our objective is to write a complete Task 1 response of at least 150 words under the 20-minute time limit, focusing on structure and clarity. This is the final and most crucial step in this module, where we simulate exam conditions. Given your background in managing projects and leading development teams, you'll find the methodical, time-boxed approach we'll use today very familiar. Think of it as a small, rapid project: you have 20 minutes to analyze requirements (the chart), design a solution (the structure), execute the plan (write), and perform a quality check (review).
1. The Blueprint: A Universal Structure and Time Plan
To succeed under pressure, you need a reliable blueprint. For Writing Task 1, this consists of a non-negotiable four-paragraph structure and a strict time management plan. Sticking to this framework eliminates guesswork and ensures you produce a complete, well-organized response every time.
First, let's solidify the structure. It applies to every chart, graph, map, or diagram you will ever encounter in this task.
IELTS Academic Writing Task 1: Master Graph & Chart Reports (2026 Guide)
This guide from Langogh provides an excellent, examiner-approved four-paragraph structure that is essential for scoring Band 7 and above. It clearly defines the purpose and content of each paragraph.
Please read the section titled "The Band 7+ Structure". Pay close attention to the distinction between the Overview (general trends, no data) and the Body Paragraphs (specific details with data). This separation is critical.
Now, let's pair this structure with a time plan. With only 20 minutes available, every minute counts. Poor time management is a primary reason candidates underperform. The following breakdown will help you allocate your time effectively.
IELTS Writing Task 1: How to Describe Any Graph or Chart (Band 7+ Guide) | OpenIELTS
This resource from OpenIELTS offers a precise time allocation strategy that aligns perfectly with the four-paragraph structure.
Focus on the table under the heading "How to Use Your 20 Minutes Wisely." Commit this 3-2-13-2 minute breakdown (Analyze-Plan-Write-Review) to memory. In your professional work, you wouldn't start coding without a plan; the same logic applies here. The initial analysis and planning phase is the most valuable investment you can make.
2. Guided Practice: Executing the Plan
Let's apply this blueprint to a sample task. We'll use the bar chart below, which presents data over time and across multiple categories, making it a good test of your skills.
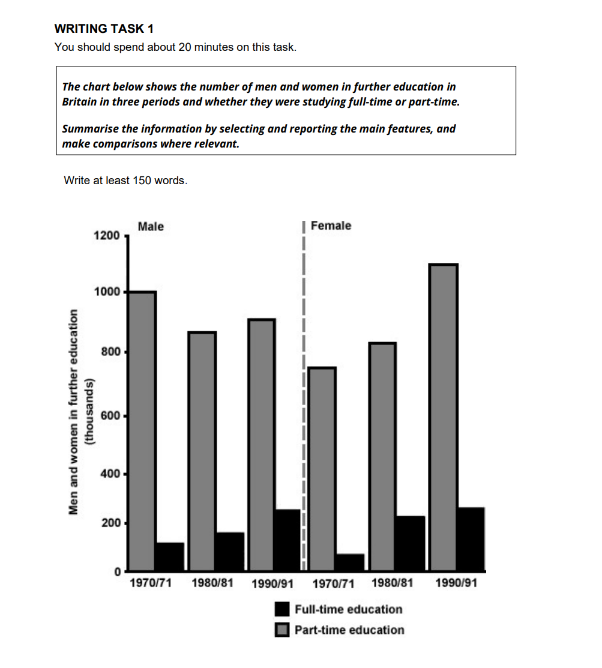
We will follow the 20-minute plan meticulously.
Phase 1: Analyze & Plan (3-5 minutes)
Before writing a single word of the report, we must understand the data and form a plan. This involves identifying the main features that will form your overview.
The video below offers a masterclass in how to analyze a graph from a "high level" to pick out the most important trends for your overview.
IELTS Writing Task 1 Academic For Beginners in 2026
This video from IELTS Advantage provides an outstanding step-by-step guide on how to approach a Task 1 question, from initial analysis to writing.
Watch the section from this segment where the instructor demonstrates how to look at data from a "30,000 ft view." Notice how he identifies the most important points by thinking like a newspaper reporter or someone summarizing for a busy manager. This is exactly the mindset you need.
Applying that thinking to our bar chart, what are the most significant trends?
- Overall Trend: The number of students in part-time education increased significantly for both genders, while full-time student numbers remained relatively low and stable.
- Key Feature 1 (Women): The most dramatic change is the surge in women in part-time education, which more than tripled over the period.
- Key Feature 2 (Men): The number of men in part-time education saw a slight decrease initially before rising, but they were overtaken by women by 1990/91.
This analysis now directly informs our structure:
- Introduction: Paraphrase the prompt.
- Overview: State the three key features identified above.
- Body Paragraph 1: Detail the figures for part-time education, focusing on the significant rise for women and comparing it to the trend for men.
- Body Paragraph 2: Detail the figures for full-time education, highlighting that they were much lower and showed less change.
Phase 2 & 3: Write & Review (15 minutes)
With a clear plan, the writing process becomes a task of execution. Here is a Band 7+ model answer based on our plan.
The bar chart illustrates the number of male and female students, in thousands, enrolled in full-time and part-time further education in Britain during three periods: 1970/71, 1980/81, and 1990/91.
Overall, there was a substantial increase in the number of people in part-time education, with the figure for women growing most significantly. In contrast, the number of students in full-time education remained much lower and showed little change over the two decades.
Focusing on part-time studies, the number of men started at approximately 1,000,000 in 1970/71, dipped to around 850,000 in 1980/81, and then recovered to about 900,000 by 1990/91. Conversely, the number of female part-time students began lower at roughly 750,000 but then experienced a dramatic rise, climbing to over 1,100,000 by 1990/91 and surpassing the number of their male counterparts.
Meanwhile, full-time education attracted far fewer students. The number of men in full-time study remained consistently low, hovering at just under 200,000 throughout the entire period. Similarly, the figure for women in full-time education was also stable, fluctuating between approximately 220,000 and 250,000.
Word Count: 188 words.
3. Independent Timed Practice
Now, it is your turn. You will apply the same methodical process to a new task.
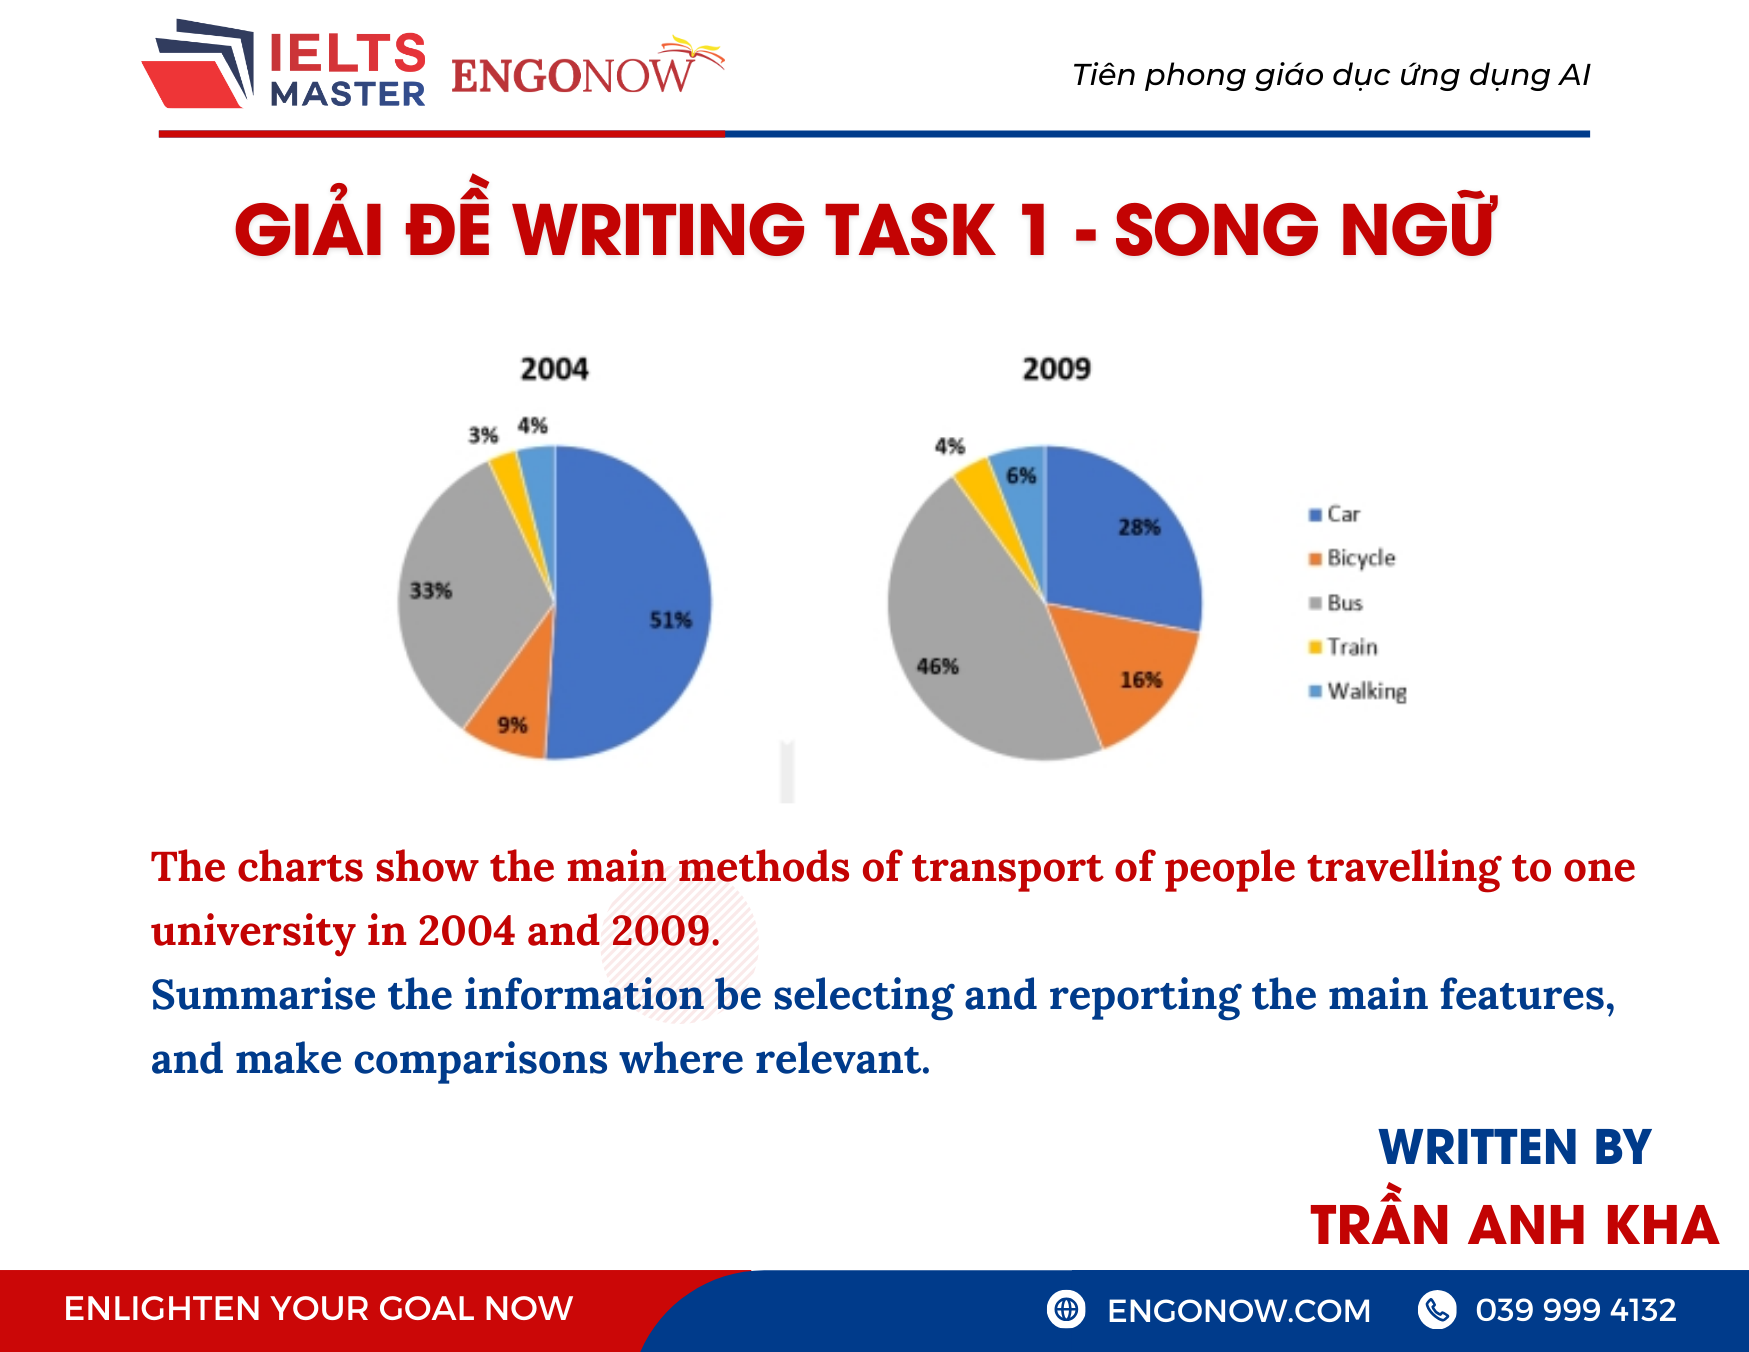
Your Task:
Set a timer for 20 minutes. Analyze the charts, plan your response, write a report of at least 150 words, and leave time to review your work. Begin now.
Self-Assessment
Once your 20 minutes are up, use the following checklist to assess your response. This process of self-correction is vital for improvement. The checklist is adapted from the final section of the IELTS Advantage video.
Introduction:
- Does my introduction accurately paraphrase the task description?
- Does it clearly state what the charts show and for which years?
- Is it free of spelling and grammar errors?
Overview:
- Is there a clear, separate overview paragraph? (Usually paragraph 2)
- Does it start with "Overall,"?
- Does it identify 2-3 main features/trends without any specific percentages? (e.g., Car usage fell dramatically while bus travel became much more popular).
- Did I avoid including any numbers or data in the overview?
Detail Paragraphs:
- Is my paragraphing clear? (i.e., a blank line between each paragraph).
- Is the information organized logically? (e.g., one paragraph on the major changes, one on the minor ones).
- Have I selected only the most significant data points to report?
- Is the data I included accurate?
- Have I made direct comparisons where relevant (e.g., "In contrast...", "Similarly...")?
Overall Report:
- Is the word count over 150 words but under 200?
- Is my language for describing proportions accurate (e.g., "accounted for just under a third," "rose to almost half")?
- Have I checked for common grammar errors (tenses, subject-verb agreement, articles)?
By consistently using this checklist, you'll internalize the requirements for a high-scoring response, turning it into second nature on test day.
Conclusion
Today, we've consolidated your Writing Task 1 skills into a single, repeatable process. You've learned that a successful response is not just about language, but about efficient project execution within a tight deadline.
Key Takeaways:
- The 4-Paragraph Blueprint is Universal: Always use the Introduction, Overview, Body 1, and Body 2 structure.
- Time Management is Non-Negotiable: Adhere to the Analyze (3-5 mins), Write (13-15 mins), and Review (2 mins) plan.
- The Overview is King: It must summarize the main trends without specific data. Missing or poorly written overviews are the most common reason for low scores.
- Select, Don't Describe Everything: Your body paragraphs should support your overview with carefully selected data, not list every number from the chart.
This lesson concludes our focused work on Writing Task 1. You now have a complete framework to tackle any visual information task. In our next lesson, we will shift our attention to the second and more heavily weighted part of the writing test, as we begin Module 6: Writing Task 2: Structuring the Academic Essay. We'll start by learning how to analyze essay prompts and build a solid plan for your argument.