Welcome back! In our last lesson, we focused on crafting the perfect overview paragraph, which gives the examiner a high-level summary of the most important features in a chart. This sets the stage for a Band 7 response. Now, it's time to build the body paragraphs by describing those features in detail.
Today's lesson addresses the learning outcome: to use appropriate vocabulary and tenses to describe trends and changes in dynamic charts (like line and bar graphs). This skill is fundamental to your Lexical Resource and Grammatical Range scores, which together account for half of your marks in Writing Task 1. We will move from the "what" of the overview to the "how" of detailed description, equipping you with the precise language needed to explain data movements accurately.
1. The Two Grammatical Structures for Describing Change
When describing a trend, you have two primary sentence structures at your disposal. Mastering both is essential for demonstrating grammatical variety, a key criterion for a Band 7. Think of them as two different syntactical patterns for expressing the same idea.
The following video from Woodward English provides an exceptionally clear explanation of these two structures and the vocabulary that accompanies them.
IELTS Academic Writing Task 1 | Describing Trends | IELTS Vocabulary & Word Order | Business English
This video is a comprehensive guide to the vocabulary and grammar of trends. It breaks down the core concepts in a very structured way.
Please watch the following three segments carefully: Verb + Adverb vs. Adjective + Noun: Watch from this section. It explains the fundamental difference between describing a trend with a verb (e.g., "sales dropped") versus a noun (e.g., "there was a drop"). Pay close attention to the word order. Sentence Construction Examples: Watch from this part and then the summary from this part. These sections show you exactly how to build sentences using both patterns. Notice the use of "There was a..." for the noun-based structure.
To summarize the core idea from the video, you can describe a change in two main ways:
-
Structure 1: Subject + Verb + Adverb
- Example: Sales fell sharply.
- Here, the verb (fell) describes the action, and the adverb (sharply) describes how it happened.
-
Structure 2: There + be + Adjective + Noun
- Example: There was a sharp fall in sales.
- Here, the noun (fall) names the trend, and the adjective (sharp) describes the noun.
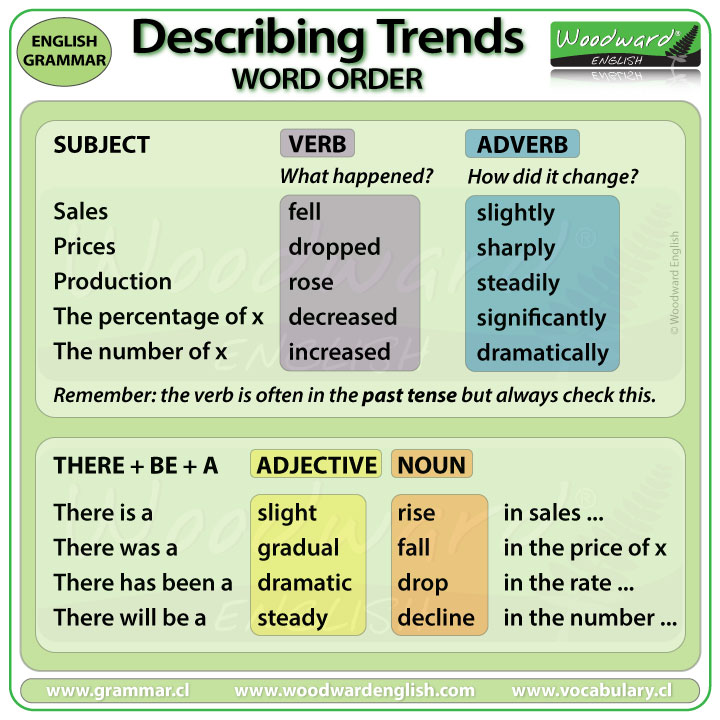
As you saw in the video, since most IELTS charts deal with data from completed time periods (e.g., from 1990 to 2010), the Simple Past Tense (increased, dropped, rose) is the most common and appropriate tense to use.
2. Building Your Lexicon: The Vocabulary of Trends
Using only "increase" and "decrease" is not enough for a Band 7. You need to demonstrate a wider range of vocabulary. The language of trends can be categorized by the direction and magnitude of the change.
Upward and Downward Movement
Let's start by building a strong vocabulary base for trends. The article "IELTS Line Graph Vocabulary" from IELTS Liz is an excellent, concise resource for this.
This article provides clear, categorized lists of verbs and nouns for describing trends.
Please review the lists under the headings "Upward Trend Words" and "Downward Trend Words". As you read, notice that many verbs can also be used as nouns (e.g., a drop/to drop, a rise/to rise).
Modifiers: Adding Precision with Adjectives and Adverbs
Simply stating that something "increased" is not very descriptive. Did it increase by a small amount over a long time, or did it shoot up suddenly? Using modifiers (adjectives and adverbs) to describe the degree of change is what separates a basic description from a high-scoring one.
Now, let's add the modifiers. This section from the same IELTS Liz article lists the essential adjectives and adverbs.
Read the section "Line Graph Adverbs & Adjectives". Categorize them in your mind: Large change: dramatic, sharp, significant, considerable Small/Slow change: slight, steady, gradual, minimal
Specific Trend Patterns
Some trends are not simple upward or downward movements. Your vocabulary should also include words for more complex patterns.
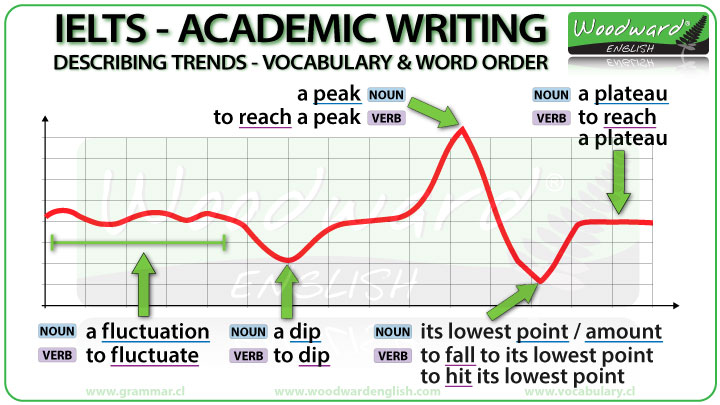
As the image shows, you should be familiar with:
- a peak (to reach a peak): The highest point.
- a plateau (to reach a plateau): A period of stability after an increase.
- a dip (to dip): A temporary fall before recovering.
- a fluctuation (to fluctuate): An irregular up-and-down movement.
- its lowest point (to fall to its lowest point): The absolute bottom of a trend.
3. Expanding to Band 7+ Vocabulary and Collocations
To push your vocabulary into the Band 7-8 range, it's not enough to know the words; you must use them precisely and with natural collocations (words that frequently go together).
The "BabyCode Blog" article provides an excellent deep dive into advanced vocabulary and usage.
IELTS Writing Task 1: 12 Verbs for Change and Trend with ...
This resource goes beyond simple lists, providing context, collocations, and examples for advanced vocabulary.
First, quickly scan through the 12 essential verbs to see how they are grouped by intensity (e.g., rise vs. soar, fall vs. plummet). Next, focus on the section "Advanced Usage Patterns and Structures". This shows you how to combine verbs and adverbs effectively. Finally, review the "Common Mistakes" section. This will help you avoid frequent errors, such as using a dramatic verb for a gradual change.
4. Guided Practice
Your "practice-first" preference is key to mastering this skill. Let's apply what you've learned.
Exercise 1: Fill in the Blanks
This exercise from the IELTS Liz article will test your ability to select the correct word (verb or noun) for the context.
This is a quick application exercise.
Look at the graph provided and complete the five sentences in the "Practice with Nouns and Verbs" section. Check your answers afterwards by clicking the reveal button on the page.
Exercise 2: Sentence Transformation
This will test your grammatical flexibility. Rewrite the following sentences using the alternative structure.
- The price of oil rose sharply.
(Rewrite using the adjective + noun structure: "There was...") - There was a gradual decline in the number of students.
(Rewrite using the verb + adverb structure: "The number of students...")
Answers:
- There was a sharp rise in the price of oil.
- The number of students declined gradually.
This ability to paraphrase your own sentences is a powerful tool for achieving a high score in Grammatical Range and Accuracy.
Conclusion
Today we have built a comprehensive toolkit for describing trends in dynamic charts. You've moved beyond a simple "up or down" description to a more precise and sophisticated level of analysis required for a Band 7.
Key Takeaways:
- Two Core Structures: You can describe trends using either a Verb + Adverb structure (e.g., profits grew steadily) or an Adjective + Noun structure (e.g., there was a steady growth in profits).
- A Rich Lexicon is Key: Use a variety of verbs and nouns for upward (rise, increase, soar), downward (fall, decline, plummet), and other movements (fluctuate, plateau).
- Modifiers Add Precision: Use adverbs and adjectives to describe the degree of change (sharply, significantly, gradually, slightly).
- Use the Simple Past Tense: For trends that have finished, the simple past tense is your default choice.
In our next lesson, we will shift our focus from dynamic charts that show change over time to static charts. You will learn how to use comparative and superlative language to describe proportions in static charts (pie charts/tables), another essential skill for Writing Task 1.