In our previous lessons, we've built a solid foundation for Writing Task 1. You learned how to craft an effective overview paragraph and then how to describe trends and changes in dynamic charts like line graphs. Now, we will pivot to another crucial skill required for this task.
Today's lesson addresses the learning outcome: to use comparative and superlative language to describe proportions in static charts (pie charts/tables). Unlike dynamic charts that show change over time, static charts present a snapshot of data. Your task here isn't to describe trends, but to analyze and compare the relationships between different categories. Mastering this skill is essential for demonstrating the analytical depth needed for a Band 7 score.
1. The Mindset Shift: From Trends to Comparisons
In the last lesson, our vocabulary was filled with words like increase, fall, and fluctuate. For static charts—pie charts, tables, and some bar charts that don't show time progression—this vocabulary is irrelevant. The goal is not to describe movement but to highlight relationships: which part is biggest? Which is smallest? How do two categories relate to each other?
Simply listing the data is not enough. For example, saying "Category A is 40% and Category B is 20%" is mere description. A high-scoring response interprets this: "Category A is twice as large as Category B," or "Category A represents the largest proportion, while Category B accounts for only half that amount." This shift from observation to interpretation is what examiners look for.
This excellent article from Learn English Weekly explains why comparison is so fundamental to success in Task 1.
IELTS Task 1 Comparison Language Explained (With Examples)
This article clearly articulates the difference between simple description and the analytical comparison required for a high band score.
As you read, focus on these key ideas: The section "Why Comparison Is Central to Task 1" explains that Task 1 is an interpretation task, not a description task. Pay close attention to the distinction made in "Comparison vs Description." Understanding this is crucial for moving beyond a Band 6. Read about its application to static data in the section "Comparing Categories in Static Data." Finally, absorb the advice on "Selecting What to Compare." You don't need to compare everything; focus on the most significant points.
2. The Language of Proportions and Comparisons
To make effective comparisons, you need a flexible toolkit of vocabulary and grammatical structures. This includes comparatives, superlatives, and language to express proportions like percentages and fractions.
Comparatives and Superlatives
These are the grammatical cornerstones of comparison.
-
Comparatives (comparing two items):
- Slightly/considerably more/less popular than...
- A higher/lower percentage than...
- Almost twice as high as...
- Followed by...
-
Superlatives (highlighting the top or bottom item):
- The most/least popular category...
- The highest/lowest proportion...
- The second largest segment...
The article from IDP IELTS provides some good examples of this language in action.
Describing Trends and figures in IELTS Academic Writing ...
This official resource gives clear examples of comparative sentences.
Please read the section titled "Making comparisons". Notice how the second example sentence is much richer and more analytical than the first because it compares two similar items and highlights a subtle difference.
Vocabulary for Proportions: Percentages, Fractions, and Approximations
Varying your language is key. Instead of always writing "X percent," you can use fractions and other expressions. This video from BestMyTest offers an excellent vocabulary-building guide.
IELTS Academic Writing Task 1 - Vocabulary for Pie charts (Describe percentages)
This video provides a fantastic breakdown of vocabulary for describing percentages in pie charts, a skill that translates directly to tables and other static charts.
Please watch the following segments to build your vocabulary toolkit: Verbs for Percentages: Note down verbs like accounted for, made up, constituted, and comprised. Comparing Percentages: Learn how to use respectively to list multiple figures cleanly and collectively to combine them. General Proportions: This part shows how to use phrases like a small percentage or a large segment, and how to make them comparative (a smaller percentage than...). Using Fractions: This is crucial for variety. Pay attention to phrases like one in ten (10%), a quarter (25%), half (50%), and three-quarters (75%). Approximations: Learn how to describe numbers that aren't exact fractions using modifiers like just over, slightly more than, and just under.
3. Guided Practice: Deconstructing a Mixed Chart
Now let's apply this language, following your "practice-first" preference. We will analyze a mixed chart, which combines a pie chart and a table. This is a common Task 1 format.
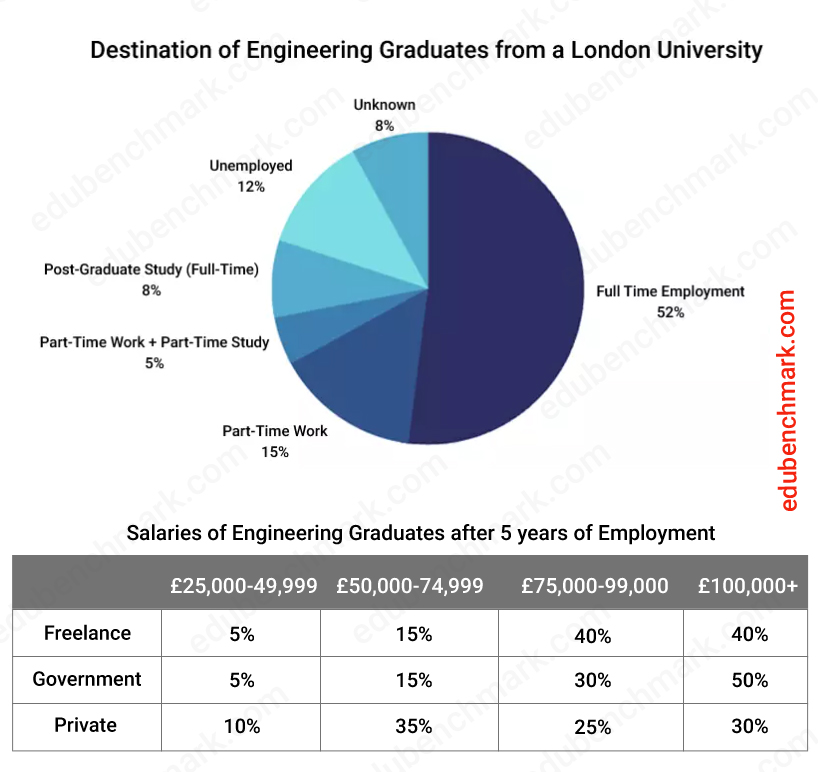
This task requires you to summarize the pie chart and then compare the salaries across the three employment sectors in the table. The following video from Lilie IELTS provides a brilliant, step-by-step walkthrough of how to approach this exact chart.
How to Describe Mixed Charts With a Lot of Data [IELTS Writing Task 1 Pie Chart and Table]
Watching an expert deconstruct the task is an excellent way to learn the required techniques. This video will show you how to select key features and use comparative language effectively.
Focus on these two key sections: Describing the Pie Chart Watch this part to see how the presenter groups similar categories (e.g., all forms of study) and uses comparative language (compared with, made up a small minority). Notice the decision to ignore the 'Unknown' category, as it's not meaningful data. Describing the Table Now watch this detailed breakdown. Pay close attention to the strategy: Selection: The presenter doesn't report every number. They select data that tells a story (e.g., which sectors pay well). Grouping: They group the top two salary bands to make a broad, powerful comparison (80 percent... earned at least $75,000). Comparative Language: Listen for words like although (to show contrast), in comparison, and versus.
4. Independent Practice
Now it's your turn to apply these skills. Let's use a different table to practice making comparisons without a video guide.
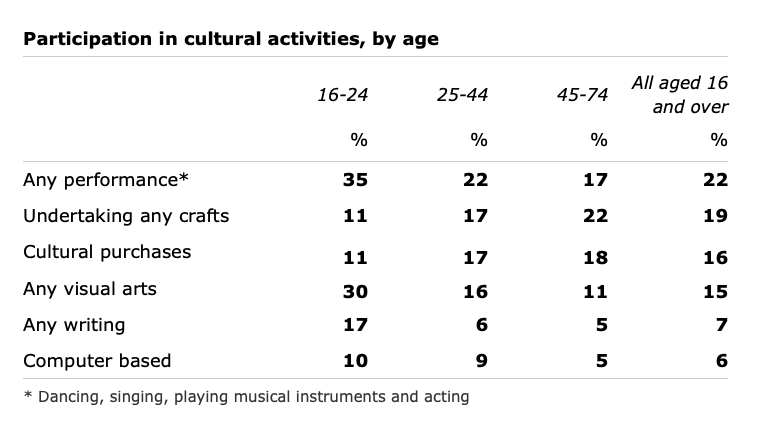
Your Task:
Write 3-4 sentences that compare the data for "Any visual arts" and "Undertaking any crafts." Your sentences should use comparative and superlative language to highlight the main differences and similarities between the age groups for these two activities.
Take about 5-7 minutes to write your sentences. Then, compare your writing to the model answer below.
Model Answer:
- Participation in 'Any visual arts' was highest among the 16-24 age group, at 30%, a figure nearly double that of the 25-44 age group (16%).
- Conversely, 'Undertaking any crafts' was most popular with the 45-74 age group (22%), while the youngest group had the lowest participation rate at just 11%.
- Overall, the trends for these two activities were inverse: engagement in visual arts declined significantly with age, whereas engagement in crafts increased.
Notice how the model answer avoids simply listing the six numbers. It groups data, uses superlatives (highest, lowest), comparatives (nearly double), and a concluding sentence to summarize the relationship.
Conclusion
Today, we've added a vital set of tools for tackling static charts. You have learned to move beyond simple data reporting and into the realm of analytical comparison, which is exactly what IELTS examiners reward with high scores.
Key Takeaways:
- Static vs. Dynamic: Static charts (pie charts, tables) require the language of comparison and proportion, not the language of trends.
- Core Grammar: Use comparative (
more than,-er than) and superlative (the most,the -est) structures to highlight key relationships in the data. - Vocabulary is Variety: Avoid repeating percentages by using fractions (
a quarter,a third), approximations (roughly,almost), and different verbs (account for,constitute). - Group and Compare: The most effective strategy is to group related data points to make meaningful comparisons, rather than listing every figure individually.
In our next lesson, we will bring everything together. You will learn how to write a complete Task 1 response of 150+ words under the 20-minute time limit, combining the overview, body paragraphs for dynamic or static charts, and structuring it all for maximum clarity and impact.