Hello! Welcome to your next lesson in the "Full Stack AI Application Development" module.
In our previous lesson, we designed the high-level architecture for a full-stack AI application. We identified the key components—a front-end, a back-end, ML model services, and various data stores—and discussed the principles like scalability and reliability that hold them together. You learned that the front-end, or the Application Layer, is the user's entry point into this entire system.
Today, we're going to build that front-end. This lesson will teach you how to build interactive AI application interfaces using Streamlit.
Streamlit is a powerful open-source framework that lets you create and share beautiful, custom web apps for machine learning and data science—all in Python. For a full-stack AI developer, it's an invaluable tool for rapid prototyping, creating internal tools, and building data-centric UIs without needing to become an expert in JavaScript, HTML, and CSS.
1. What is Streamlit?
At its core, Streamlit turns a Python script into an interactive web application. It follows a simple execution model: every time a user interacts with a widget (like clicking a button or moving a slider), the entire script reruns from top to bottom. Streamlit intelligently handles the underlying state and updates the UI.
To understand this concept better, please read the introductory section of the following article.
This section from the 'Ultimate guide to the Streamlit library' provides a concise explanation of Streamlit's client-server architecture and its simple 'recompute on each change' execution model.
Read the entire section 'What Is Streamlit In Python?'. Focus on understanding the client-server architecture and the simple execution model.
As the article explained, Streamlit abstracts away the complexities of web development, allowing you to focus on your data and models.
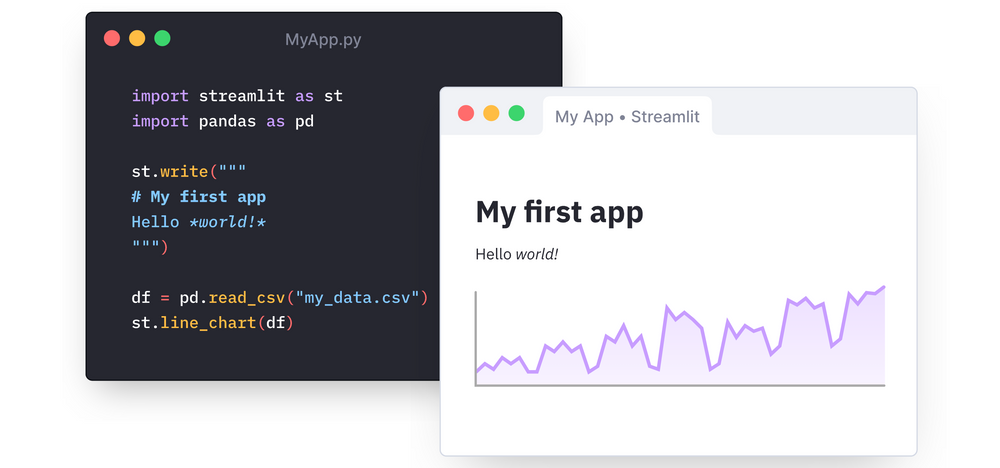
This approach is especially powerful for building proofs-of-concept (PoCs) for machine learning ideas, which you can read more about in the "Why Streamlit?" section of the "Kickstarting ML Apps with Streamlit" article (resource ID LINK).
2. Getting Started & Basic Elements
Let's dive in and build our first Streamlit app. The best way to learn is by doing. We'll start with installation and then create a simple "Hello World" application that displays text and an image.
The video below provides a clear, step-by-step walkthrough of this initial process.
Streamlit Mini Course - Make Websites With ONLY Python
This segment from the 'Streamlit Mini Course' by Tech With Tim will guide you through installing Streamlit, running your first app, and understanding the hot-reloading feature.
Watch the video from the beginning until 07:25. Follow along to install Streamlit in your virtual environment and run your first basic application.
As you saw, getting started is as simple as:
pip install streamlit- Creating a Python file (e.g.,
app.py) - Writing Streamlit commands like
st.title() - Running
streamlit run app.pyin your terminal
Displaying Text and Media
Streamlit provides a variety of functions to display different types of content. Let's expand on the basic st.write() and explore how to display formatted text, code, and images.
The next segment of the same video covers these elements.
Streamlit Mini Course - Make Websites With ONLY Python
This part of the mini-course demonstrates how to use various text and media elements that are essential for creating a descriptive and visually appealing interface.
Watch from 14:24 to 19:29. Pay attention to the syntax for st.title, st.header, st.markdown, st.code, and st.image.
Here's a quick summary of the key functions for displaying content:
st.title("My App"): The main title of the page.st.header("Section 1"): A section header.st.subheader("Subsection A"): A smaller sub-header.st.markdown("This is **bold** and this is _italic_."): Renders text using Markdown syntax.st.code("print('Hello')", language="python"): Displays a block of code with syntax highlighting.st.image("path/to/image.jpg", caption="My Image"): Displays an image from a file path or URL.
3. Displaying Data and Charts
Since Streamlit is designed for data applications, it excels at displaying dataframes and charts. This is crucial for showing model results, exploring datasets, or visualizing predictions.
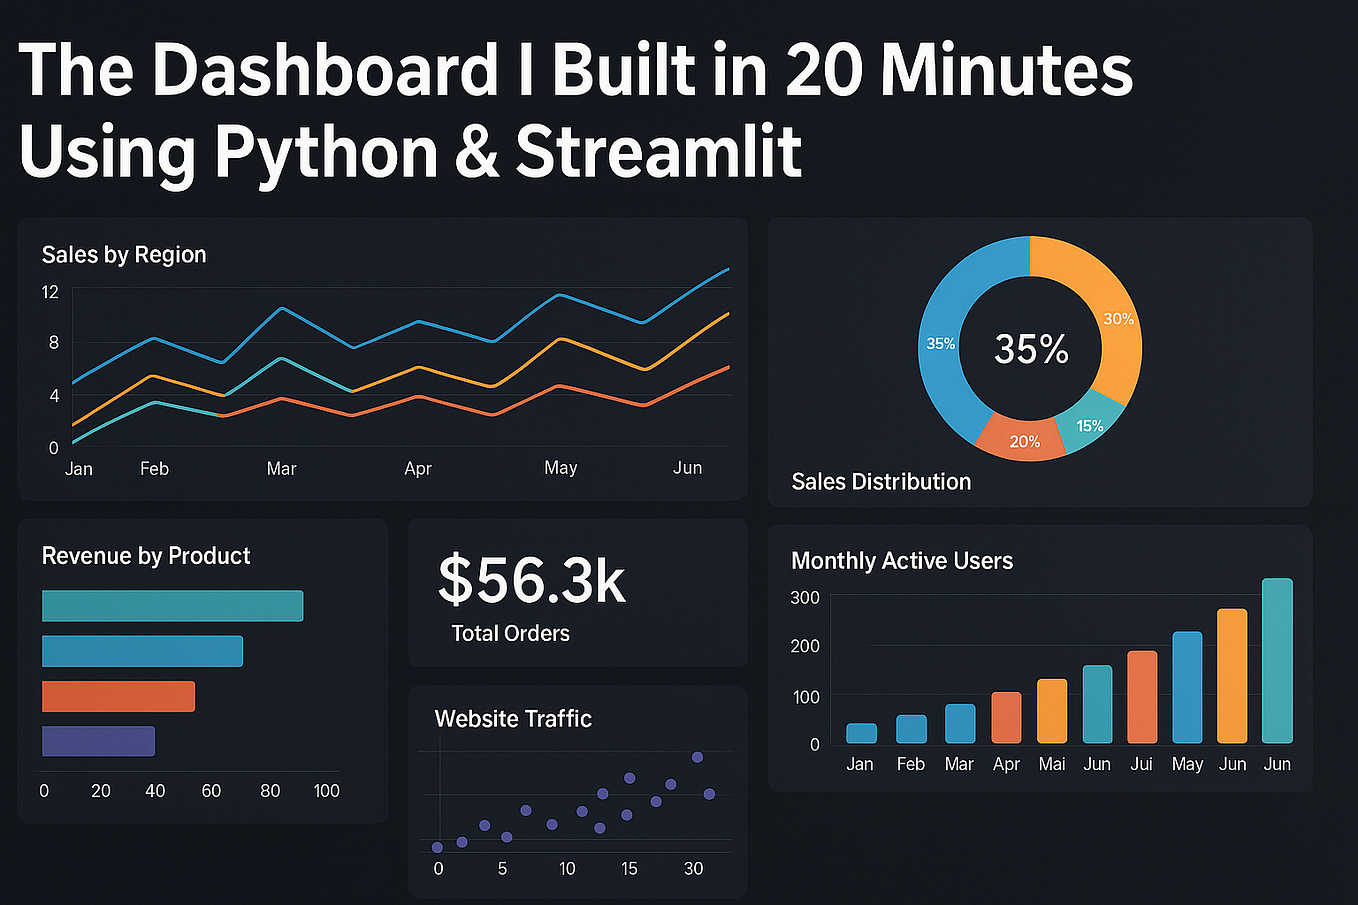
Let's see how easy it is to add data tables and charts to our app.
Streamlit Mini Course - Make Websites With ONLY Python
This video segment covers Streamlit's native data and chart elements, which allow you to visualize pandas DataFrames with just a single line of code.
Watch from 19:29 to 25:14. Focus on st.dataframe, st.metric, and the built-in chart functions like st.bar_chart and st.line_chart.
Key data display functions:
st.dataframe(my_pandas_df): Displays a pandas DataFrame as an interactive table.st.table(my_pandas_df.head()): Displays a static, non-interactive table.st.metric(label="Accuracy", value="95%", delta="2%"): Shows a large, prominent number, ideal for key performance indicators (KPIs).st.line_chart(data),st.bar_chart(data): Quick ways to create simple charts directly from your data.
For more complex visualizations, you can use libraries like Matplotlib or Plotly and render them with st.pyplot() and st.plotly_chart(), respectively.
4. Building an Interactive ML Interface
Now we get to the heart of Streamlit: interactivity. Widgets are the UI elements that allow users to provide input, which your app can then use to update its output. This is how you'll let users tune model parameters, upload their own data, or enter text for prediction.
We'll learn how to use widgets and layout elements by building a simple interface for a machine learning classifier. The goal is to create a UI that allows a user to:
- Select a dataset.
- Choose a classifier (e.g., KNN, SVM).
- Adjust the classifier's parameters using sliders.
- See the results.
The following video is an excellent project-based tutorial that builds exactly this.
Build A Beautiful Machine Learning Web App With Streamlit And Scikit-learn | Python Tutorial
In this video, Patrick Loeber builds a complete ML web app. We'll focus on the sections where he creates the interactive sidebar with widgets to control the model.
Watch from 04:50 to 21:15. This is a longer segment, so feel free to pause and experiment. Focus on: How st.selectbox is used to choose a dataset and classifier. How widgets are moved to the sidebar using st.sidebar. How st.slider is used to get numerical input for model parameters. The logic used to dynamically show different sliders based on the chosen classifier.
Putting it all together
Inspired by the video, let's create a simplified but complete application. Create a new file, app.py, and add the following code. This script demonstrates the use of layout (sidebar, columns) and widgets (selectbox, slider, button) to create a functional interface.
import streamlit as st
import pandas as pd
import numpy as np
from sklearn.neighbors import KNeighborsClassifier
from sklearn.svm import SVC
from sklearn.model_selection import train_test_split
from sklearn.preprocessing import StandardScaler
from sklearn.metrics import accuracy_score


# --- App Title and Description ---
st.title("Simple Classifier Web App")
st.markdown("Explore different classifiers and datasets.")


# --- Sidebar for User Input ---
st.sidebar.header("Configuration")


# 1. Dataset Selection
dataset_name = st.sidebar.selectbox(
    "Select Dataset",
    ("Iris", "Breast Cancer", "Wine")
)


# 2. Classifier Selection
classifier_name = st.sidebar.selectbox(
    "Select Classifier",
    ("KNN", "SVM")
)


# --- Function to load dataset ---
@st.cache_data  # Cache the data to avoid reloading on every interaction
def get_dataset(name):
    if name == "Iris":
        from sklearn.datasets import load_iris
        data = load_iris()
    elif name == "Breast Cancer":
        from sklearn.datasets import load_breast_cancer
        data = load_breast_cancer()
    else:
        from sklearn.datasets import load_wine
        data = load_wine()
    X = data.data
    y = data.target
    return X, y

X, y = get_dataset(dataset_name)


# --- Main Panel: Display Dataset Info ---
st.header(f"Dataset: {dataset_name}")
st.write(f"Shape of dataset: {X.shape}")
st.write(f"Number of classes: {len(np.unique(y))}")


# --- Function to add classifier-specific parameters to the sidebar ---
def add_parameter_ui(clf_name):
    params = dict()
    if clf_name == "KNN":
        K = st.sidebar.slider("K (Number of Neighbors)", 1, 15, 5)
        params["K"] = K
    else: # SVM
        C = st.sidebar.slider("C (Regularization parameter)", 0.01, 10.0, 1.0)
        params["C"] = C
    return params

params = add_parameter_ui(classifier_name)


# --- Function to get the classifier with specified parameters ---
def get_classifier(clf_name, params):
    if clf_name == "KNN":
        clf = KNeighborsClassifier(n_neighbors=params["K"])
    else:
        clf = SVC(C=params["C"])
    return clf

clf = get_classifier(classifier_name, params)


# --- Train and Evaluate the model on button click ---
if st.button("Train Model"):
    with st.spinner("Training in progress..."):


        # Split data
        X_train, X_test, y_train, y_test = train_test_split(X, y, test_size=0.2, random_state=42)


        # Scale data
        scaler = StandardScaler()
        X_train = scaler.fit_transform(X_train)
        X_test = scaler.transform(X_test)


        # Train classifier
        clf.fit(X_train, y_train)
        y_pred = clf.predict(X_test)


        # Calculate accuracy
        acc = accuracy_score(y_test, y_pred)

    st.success("Training complete!")
    st.metric(label="Model Accuracy", value=f"{acc:.2%}")
Run this script with streamlit run app.py. Play with the controls in the sidebar. Notice how changing the sliders or dropdowns instantly reruns the script and updates the app. The core logic for training only runs when you click the "Train Model" button.
Conclusion
In this lesson, you've taken the first practical step in building a full-stack AI application by creating an interactive user interface. You learned that with Streamlit, you can stay within the Python ecosystem and rapidly build and share powerful data apps.
Key Takeaways:
- Streamlit allows you to build web UIs using only Python, which is ideal for ML engineers and data scientists.
- The core workflow involves writing a script, adding
st.commands, and running it withstreamlit run. - You can display text, data, and charts using functions like
st.markdown,st.dataframe, andst.bar_chart. - Interactivity is achieved through widgets like
st.button,st.slider, andst.selectbox. - You can organize your app's layout using
st.sidebarandst.columnsto create clean and intuitive interfaces.
Preview of the Next Lesson:
We've now built a user-facing interface. In a simple app like the one above, the UI and the ML logic live in the same script. However, for a scalable, production-grade application (as we designed in the previous lesson), we need to separate these concerns.
In the next lesson, "Integrate ML models with backend APIs and create prediction endpoints," we will build the backend service that our Streamlit UI will eventually communicate with. This is a crucial step in creating a robust, microservices-based architecture.