Hello! Welcome back to our module on Data Analysis and Visualization.
In our last lesson, we took the first crucial steps in data wrangling. We learned how to load a dataset into a pandas DataFrame, conduct an initial inspection, and perform "first-pass" cleaning tasks like removing unnecessary columns, standardizing formats, and getting a first look at handling duplicates and missing values with drop_duplicates(), dropna(), and fillna().
Today, we'll build directly on that foundation. This lesson focuses on the learning outcome: Handle missing values, duplicates, and outliers using statistical methods. Clean, reliable data is the bedrock of any successful AI model, and mastering these techniques is non-negotiable for an AI developer.
By the end of this lesson, you will be able to:
- Apply more advanced strategies for handling missing data, including imputation and interpolation.
- Confidently remove duplicate records, including those based on a subset of columns.
- Define, detect, and handle outliers using common statistical methods like the Z-score and Interquartile Range (IQR).
Let's refine your data cleaning toolkit.
1. Handling Missing Values: A Deeper Dive
In the last lesson, we saw how df.isnull().sum() can quickly reveal missing data (NaN values). Many machine learning algorithms cannot function with missing data, so we must address it. We briefly touched on dropna() and fillna(), but now let's explore these and other methods with more nuance.
Strategy 1: Deletion (dropna)
The most straightforward approach is to simply remove rows or columns containing NaN values. However, this can be a double-edged sword: while it's simple, you risk losing a significant amount of valuable data. Therefore, we should use it surgically.
The video below demonstrates how to use dropna more effectively by setting conditions.
Python Pandas Tutorial 5: Handle Missing Data: fillna, dropna, interpolate
Let's watch a segment from the 'Python Pandas Tutorial' by codebasics. This part explains how to use dropna with more control, preventing you from accidentally deleting too much data.
Watch from 16:41 to 19:25. Focus on the how='all' parameter, which only drops a row if all its values are missing, and the thresh parameter, which lets you specify the minimum number of non-missing values a row must have to be kept.
- When to use
dropna: Deletion is most appropriate when a row or column is missing a very large percentage of its data, or when the missing value is in a column so critical that the entire record is unusable without it. Usingthreshgives you a great way to enforce a rule like "keep rows that have at least 5 valid data points."
Strategy 2: Imputation (Filling Values)
A more common and generally preferred strategy is imputation, which means filling in missing values with a calculated substitute. The goal is to make a reasonable guess that preserves the overall structure of the data.
Let's explore several imputation techniques, from simple to more sophisticated.
Python Pandas Tutorial 5: Handle Missing Data: fillna, dropna, interpolate
We'll return to the codebasics video to see various imputation methods in action with fillna and interpolate.
Watch the following segments: Basic Filling (03:55 - 09:20): This covers filling NaNs with a constant (like 0), using a dictionary for column-specific values, and introducing forward-fill (ffill) and backward-fill (bfill). Interpolation (13:17 - 16:10): This explains the powerful interpolate() method, which makes a more intelligent guess by considering the values before and after the missing data point. Pay attention to the method='time' argument, which is very useful for time-series data.
Let's summarize these imputation methods:
- Filling with a constant (
fillna(0)): Simple, but can distort the column's statistics (like mean and standard deviation). Best used when 0 is a meaningful value (e.g., "0 items sold"). - Filling with a statistic (
fillna(df['col'].mean())): A common choice for numerical data is to use the column's mean, median, or mode. The median is often preferred because it's less sensitive to outliers than the mean. The mode is the standard choice for categorical (non-numeric) data. - Forward/Backward Fill (
fillna(method='ffill')): This propagates the last known value forward (ffill) or the next known value backward (bfill). This is especially useful in time-ordered data where you can assume a value remained constant until the next measurement. - Interpolation (
interpolate()): This is often the most sophisticated approach for numerical data. It treats the missing point as being on a line between its neighbors. As you saw,method='linear'estimates a value evenly between its neighbors, whilemethod='time'accounts for the actual time gap, providing a more accurate estimate for time-series data.
Choosing the right method depends on the nature of your data and the reason it's missing.
2. Handling Duplicates (Review and Extend)
We covered df.drop_duplicates() in the last lesson. Let's quickly review and add a crucial detail. Duplicates can arise from data entry errors or system glitches, and they can bias your analysis by giving extra weight to the duplicated records.
Data Cleaning in Python: How to Handle Missing Values, Outliers ...
This article provides a quick and clear summary of finding and removing duplicates in pandas.
Read the short section '3. Removing Duplicate Data'. It reinforces the use of df.duplicated().sum() to check for duplicates and df.drop_duplicates() to remove them.
A common real-world scenario is when a row is not a complete duplicate, but is a duplicate based on a key identifier. For example, you might have two records for the same customer ID but with different timestamps. You may want to keep only the most recent one. You can handle this by specifying which columns to consider when checking for duplicates.
# Create a sample DataFrame
data = {'user_id': [101, 102, 101, 103],
        'action': ['login', 'browse', 'login', 'logout']}
df = pd.DataFrame(data)


# Show duplicates based on all columns (there are none)
print("Complete duplicates:", df.duplicated().sum())


# Show duplicates based only on 'user_id'
print("Duplicates by user_id:", df.duplicated(subset=['user_id']).sum())


# Drop duplicates based on 'user_id', keeping the first instance
df_unique_users = df.drop_duplicates(subset=['user_id'], keep='first')
print(df_unique_users)
The subset parameter is extremely useful for ensuring data integrity based on your dataset's unique identifiers.
3. Handling Outliers
Now we turn to a new and important topic: outliers. An outlier is a data point that deviates significantly from the rest of the observations. They can be caused by measurement errors, data entry mistakes, or genuinely rare events.
Why do we care? Outliers can:
- Distort statistical measures like the mean and standard deviation.
- Disproportionately influence the training of machine learning models, leading to poor performance (especially for linear models and anything distance-based).
Detecting and Handling Outliers
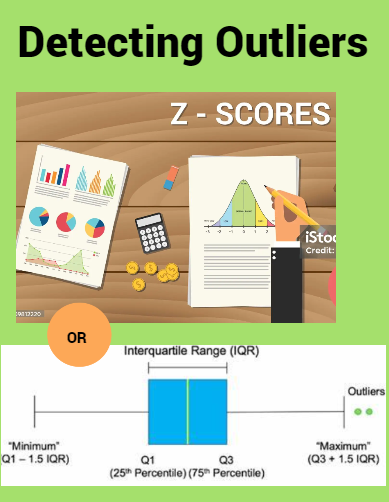
We can use statistical rules to flag data points as outliers. Two of the most common methods are the Z-score and the Interquartile Range (IQR).
The following video provides an excellent, practical walkthrough of how to implement these methods in Python. It also introduces the key decision you must make when you find an outlier: trimming (removing it) or capping (replacing it with a less extreme value).
How to Detect and Remove Outliers in the Data | Python
This video from Hackers Realm clearly demonstrates three different statistical methods for detecting and handling outliers in Python.
Watch from 01:55 to 24:14. The video is divided into three main parts: Z-Score Method (01:55 - 12:01): Understand how to use the mean and standard deviation to set upper and lower limits. Note the difference between trimming (deleting rows) and capping (replacing values with the limit). Interquartile Range (IQR) Method (12:01 - 17:12): Learn how to use quartiles to define outlier boundaries. This method is considered more 'robust' because the median and quartiles are not skewed by extreme values. Percentile Method (17:12 - 22:49): See a third intuitive method, where you define outliers as the top and bottom N% of your data. Summary (22:49 - 24:14): The conclusion nicely summarizes the impact of these techniques on the data's distribution.
Let's recap the key ideas:
- Z-Score: Measures how many standard deviations a data point is from the mean. A common rule of thumb is to consider anything with a Z-score greater than 3 or less than -3 as an outlier. This method works best when your data is approximately normally distributed (a bell curve).
- IQR Method: This method defines outliers based on the interquartile range (IQR = Q3 - Q1). Any point below
Q1 - 1.5 * IQRor aboveQ3 + 1.5 * IQRis flagged. Because it uses the median and quartiles, it is not affected by the presence of extreme outliers, making it a more robust choice for skewed data. - Trimming vs. Capping:
- Trimming: Deleting the outlier row. This is simple but results in data loss.
- Capping (or Winsorization): Replacing outlier values with the nearest "acceptable" value (i.e., the upper or lower boundary you calculated). This is often preferred as it retains the record while reducing the influence of the extreme value.
The choice of method and whether to trim or cap depends on your specific goals and domain knowledge. If an outlier is due to a clear error, removing it might be best. If it's a genuine but rare event, capping might be more appropriate.
Conclusion
Excellent work! You've now moved beyond basic cleaning and have a robust set of tools for handling some of the most common and challenging data quality issues.
Key Takeaways:
- For missing values, you can choose between controlled deletion (
dropnawiththresh) or various imputation methods likefillna(with mean/median/mode), forward/backward fill (ffill/bfill), orinterpolate()for more accurate estimates. - Duplicates can be removed based on all columns or, more practically, on a
subsetof key identifier columns. - Outliers are extreme values that can harm your analysis. You can systematically detect them using statistical methods like Z-score and IQR.
- When an outlier is found, you have a choice: trim (remove) it or cap (replace) it to mitigate its effect without losing the entire record.
In our next lesson, we will address another common data preparation task: combining data. Real-world projects rarely rely on a single data file. You'll learn how to use pandas to merge, join, and concatenate multiple DataFrames to build a comprehensive dataset for analysis.