Hello! Welcome to the first lesson of our fifth module, Data Analysis and Visualization.
In the previous module, we laid the mathematical groundwork for machine learning. We finished with Bayes' Theorem, a powerful tool for updating our beliefs with evidence. Now, we shift from the abstract world of theory to the practical, and often messy, world of real data. The concepts of probability and statistics you learned will soon come alive as we start analyzing datasets.
This lesson covers the learning outcome: Load, inspect, and clean datasets using pandas DataFrames. This is the absolute first step in any data science or AI project. Before we can build sophisticated models, we must be able to wrangle our data into a usable format.
By the end of this lesson, you will be able to:
- Understand the structure of a pandas DataFrame.
- Load a CSV file into a DataFrame.
- Use essential methods to inspect data for issues like missing values and incorrect data types.
- Perform fundamental cleaning operations, such as removing unwanted columns, handling duplicates, and correcting data formats.
Our primary tool for this entire module will be pandas, the most essential Python library for data manipulation. Let's get started.
1. The Pandas DataFrame: Your New Best Friend
Think of a pandas DataFrame as a highly enhanced version of a spreadsheet or a SQL table, but inside your Python code. It's a two-dimensional data structure with labeled rows and columns, designed to handle and analyze data efficiently.
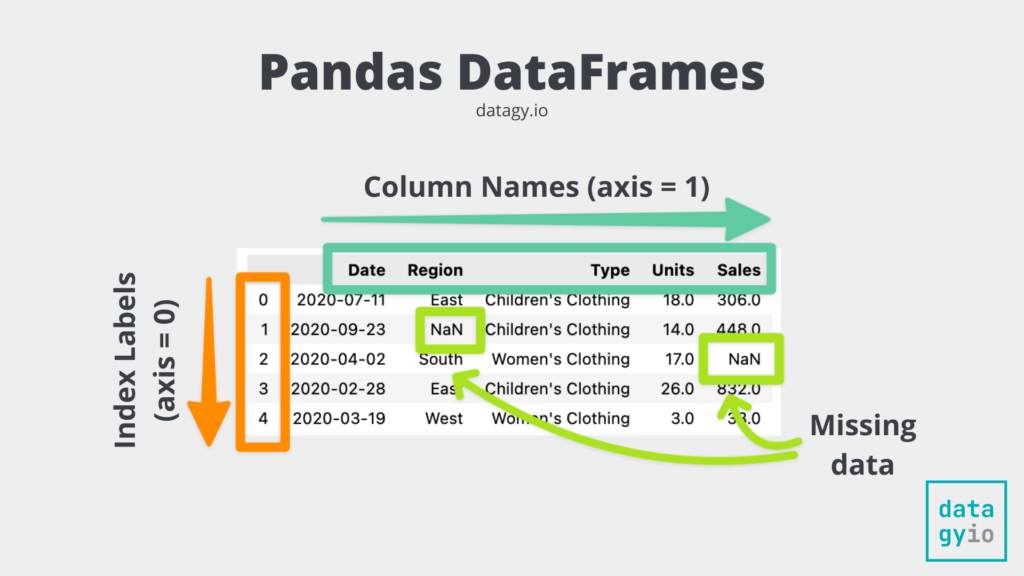
Since you're starting your journey as an AI developer, mastering the DataFrame is non-negotiable. Every dataset you encounter, from customer records to image metadata, will likely be loaded into a DataFrame for initial exploration and cleaning.
2. Loading and Inspecting Your First Dataset
The first step is always to load your data and take a look around. This "inspection" phase is like a detective's initial assessment of a crime scene—you're looking for clues about the quality and structure of your data.
Let's begin by reading about the basic commands for this process.
From Messy to Magic: A Beginner-to-Expert Guide on Data ...
This article, 'From Messy to Magic,' provides a great introduction to the foundational steps of data cleaning. It introduces the key pandas functions we'll use to get a first look at our data.
Read the section titled 'Getting Hands-On with Basic Data Cleaning', focusing on the subsection 'Inspecting the Data'. Pay attention to the purpose of pd.read_csv(), data.head(), data.info(), and data.describe().
Now, let's see these commands in action. The following video provides a clear, step-by-step walkthrough of loading a messy dataset and performing an initial inspection.
Clean Messy Data in Python (Step-by-Step for Beginners) | Pandas Tutorial 2025
This video by Data Geek is my name is a perfect tutorial for beginners. It demonstrates loading a CSV file and using basic inspection tools to understand what needs to be cleaned.
Watch from 00:25 to 02:05 to see an overview of the messy data, and then from 05:25 to 10:34 to see how to load it and inspect it using .head(), .info(), and .isnull().sum().
To summarize the key inspection functions:
df.head(): Shows the first 5 rows. Useful for a quick glance at the data and column names.df.info(): Provides a concise summary, including the number of entries, column names, the number of non-null values for each column, and their data types (Dtype). This is your primary tool for spotting missing data and incorrect types.df.isnull().sum(): Gives you a direct count of missing (NaN) values in each column.
3. A Systematic Cleaning Workflow
After inspecting the data, you'll have a to-do list of cleaning tasks. Data cleaning isn't a random process; it's a systematic workflow of identifying and fixing issues. We'll now tackle the most common "first-pass" cleaning steps.
3.1. Removing Unwanted Data
Real-world datasets often contain information that isn't relevant to your analysis. This can include duplicate records or entire columns that you don't need.
Dropping Unnecessary Columns
Keeping your DataFrame tidy by removing irrelevant columns makes your work easier and can improve performance.
Pythonic Data Cleaning With pandas and NumPy
The 'Pythonic Data Cleaning' article from Real Python has an excellent, focused section on how to drop columns from a DataFrame using the .drop() method.
Read the section 'Dropping Columns in a DataFrame'. Focus on the syntax for df.drop() with axis=1 to specify columns and inplace=True to modify the DataFrame directly.
Removing Duplicate Rows
Duplicate entries can skew your analysis and model training. For example, if a customer is listed twice, their purchases might be double-counted. Removing them is a critical step.
Data Cleaning in Pandas | Python Pandas Tutorials
The 'Data Cleaning in Pandas' video by Alex The Analyst has a very clear and concise demonstration of finding and removing duplicate rows.
Watch from 02:30 to 03:37. Notice how df.drop_duplicates() is used to remove the redundant row and how the DataFrame is reassigned to save the changes.
3.2. Standardizing Columns
Consistency is key. Columns with inconsistent naming or data that's stored in the wrong format can cause errors and lead to faulty analysis.
Cleaning Column Names
Column names with leading/trailing spaces or inconsistent capitalization are common. A simple line of code can fix this across your entire dataset.
Correcting Data Types and Values
This is one of the most frequent cleaning tasks. You might find:
- Numbers stored as text (e.g.,
'1,000','$5.99'). - Dates stored as text in various formats (e.g.,
'January 15, 2024','1/15/2024'). - Percentages stored as text (e.g.,
'15%').
Before you can perform calculations, you must clean these string values (e.g., remove $, ,, %) and then convert the column to a numeric type using pd.to_numeric.
Let's return to the "Clean Messy Data" video, which does an excellent job of demonstrating these standardization techniques.
Clean Messy Data in Python (Step-by-Step for Beginners) | Pandas Tutorial 2025
This part of the tutorial walks through several practical examples of standardizing columns, from cleaning names to converting currency and date columns.
Watch from 15:02 to 21:17. Pay close attention to the workflow for each column: Cleaning Column Names (15:02): Using .str.strip(). Standardizing Dates (15:56): Using pd.to_datetime. Cleaning Text (17:17): Using .str.title(). Cleaning Currency and Percentages (18:29 & 19:38): Using .str.replace() to remove symbols before converting to a numeric type.
3.3. Handling Missing Values: A First Look
We saw how df.info() and df.isnull().sum() help us find missing data. But what do we do about it? There are two primary strategies:
- Deletion: Remove rows or columns that contain missing values.
df.dropna(): This can be a quick fix, but you risk losing valuable data. It's often better to drop rows only if the missing value is in a critical column (subset=['critical_column']).
- Imputation: Fill the missing values with a substitute value.
df.fillna(): A common strategy for numeric columns is to fillNaNs with the column's mean or median. For categorical columns, you might use the mode or a placeholder like 'Unknown'.
The next lesson is dedicated to this topic, but let's see a quick introduction to these methods.
Clean Messy Data in Python (Step-by-Step for Beginners) | Pandas Tutorial 2025
Let's see how the two main strategies for handling missing data—imputation and deletion—are implemented.
Watch these two short clips: Imputation (10:34 - 15:02): See how fillna() is used to replace missing numeric values with the column's mean. Deletion (21:04 - 21:56): See how dropna(subset=...) is used to remove rows that are missing data in specific, crucial columns.
4. Verifying the Results
After performing your cleaning steps, it's crucial to inspect the data again to confirm your changes were successful. Running df.info() or df.head() on your cleaned DataFrame should show the fruits of your labor: no more unwanted columns, correct data types, and fewer (or no) missing values.
The "Clean Messy Data" video concludes by doing exactly this.
Clean Messy Data in Python (Step-by-Step for Beginners) | Pandas Tutorial 2025
The final step is to check your work. Let's see the 'before and after' comparison.
Watch from 21:44 to 23:18. The presenter uses .head() on the cleaned DataFrame to show how the once-messy data is now consistent and ready for analysis.
Conclusion
Great work! You've just taken your first and most important step into the world of practical data analysis. Learning to load, inspect, and clean data with pandas is a foundational skill that separates aspiring AI developers from practicing ones.
Key Takeaways:
- The pandas DataFrame is the central data structure for data analysis in Python.
- Inspection is the first step: use
head(),info(), andisnull().sum()to understand your dataset's structure and identify problems. - Cleaning is a systematic process that includes:
- Dropping unneeded columns (
.drop()) and rows (.drop_duplicates()). - Standardizing column names and values using string methods (
.str). - Correcting data types with functions like
pd.to_numericandpd.to_datetime. - Handling missing data by either deleting (
.dropna()) or filling (.fillna()).
- Dropping unneeded columns (
In our next lesson, we will dive deeper into the strategies for handling missing values, duplicates, and outliers. You'll learn the pros and cons of different imputation methods and how to detect and manage anomalous data points that can throw off your models.