Hello! Let's dive into the next step of our data analysis journey.
In the last lesson, you learned how to combine datasets using merge, concat, and join. Now that you can create a single, unified DataFrame, the next logical step is to start extracting insights from it. This is where data aggregation comes in.
This lesson is all about summarizing your data. We'll focus on the learning outcome: Perform groupby operations and pivot tables for data aggregation. You'll learn how to slice your data into groups and then calculate summary statistics for each one, such as sums, averages, or counts. This is one of the most common and powerful operations in data analysis, forming the backbone of exploratory data analysis (EDA) and feature engineering for machine learning.
The Core Idea: Split-Apply-Combine
Before we write any code, it's crucial to understand the three-step process that powers all aggregation operations in pandas: Split-Apply-Combine.
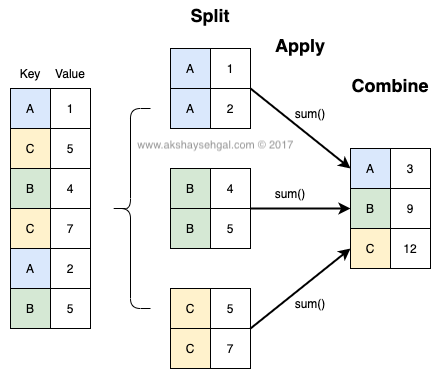
To get a more formal understanding of this concept, let's turn to a well-written article.
pandas GroupBy: Your Guide to Grouping Data in Python
The article 'pandas GroupBy: Your Guide to Grouping Data in Python' from Real Python provides an excellent explanation of the mechanics behind groupby. Understanding this will make the code much more intuitive.
Please read the section titled 'How pandas GroupBy Works'. Focus on understanding the three steps: Split, Apply, and Combine. The article also shows how you can iterate over a groupby object to see the split groups, which is a great debugging technique.
Performing Groupby Operations in Pandas
Now that you understand the theory, let's put it into practice. The DataFrame.groupby() method is our primary tool for this. We will use it to perform the "split" step, after which we can "apply" an aggregation function.
To see this in action, we'll use a detailed video guide that breaks down the process. We will work with a sample dataset about restaurant tips.
The Complete Guide to Python Pandas Groupby
The video 'The Complete Guide to Python Pandas Groupby' provides a very clear, step-by-step introduction. Let's start with the basics: grouping by a single column and applying a single aggregation.
Watch from the beginning to 12:43. The video will cover: Setup (00:00 - 03:04): How to load the sample 'tips' dataset. Basic Groupby (03:04 - 09:49): Pay close attention to how a basic groupby is constructed: df.groupby('column_to_group_by')['column_to_aggregate'].mean(). Also, notice the useful methods .reset_index() and .sort_values() to format the output nicely. Other Aggregation Functions (09:49 - 12:43): The video introduces other common aggregations like .count(), .size(), .nunique(), .max(), .min(), and .sum().
Code Summary: Basic groupby
Let's summarize what you just saw. If we have a DataFrame df and want to find the average total_bill for each day:
# Group the DataFrame by the 'day' column
grouped_by_day = df.groupby('day')


# Select the 'total_bill' column and calculate the mean for each group
average_bill_by_day = grouped_by_day['total_bill'].mean()


# This is often written in a single, chained line of code:
average_bill_by_day = df.groupby('day')['total_bill'].mean().reset_index()

print(average_bill_by_day)
The .reset_index() part is important; it converts the grouped output from a pandas Series with a special index back into a clean DataFrame.
Multiple Groups and Aggregations
The real power of groupby comes from its flexibility. You can group by multiple columns at once, and you can apply multiple aggregation functions simultaneously using the .agg() method.
The .agg() method is particularly useful. You can pass it a list of functions, or even a dictionary to apply specific functions to specific columns.
Let's continue with the video to see how this works.
The Complete Guide to Python Pandas Groupby
Now we'll explore how to group by more than one column and how to use .agg() to get richer summaries.
Please watch the following two segments from the video: Multiple Aggregations (16:18 - 20:52): This section introduces the .agg() method. Notice how you can pass a list of functions like ['min', 'max', 'median'] to get multiple summary stats at once. Grouping by Multiple Columns (20:52 - 23:48): This demonstrates how to pass a list of column names to groupby (e.g., df.groupby(['day', 'time'])) to create more granular groups.
Code Summary: .agg() with a Dictionary
One of the most powerful patterns is using a dictionary with .agg(). This allows you to apply different aggregations to different columns in one go.
# Group by 'day' and 'smoker' status
# Calculate the sum of 'total_bill' and the count (size) of 'tip'
summary_df = df.groupby(['day', 'smoker']).agg(
    total_revenue=('total_bill', 'sum'),
    number_of_tips=('tip', 'count')
).reset_index()

print(summary_df)
This syntax, where you name the new output columns inside .agg(), is modern and makes the code very readable.
Pivot Tables: groupby on Steroids
While groupby is fundamental, sometimes you want to reshape your data into a format that's easier to read, much like a pivot table in Excel. The pd.pivot_table() function is designed for exactly this. It does the same split-apply-combine but presents the result in a wide, matrix-like format.
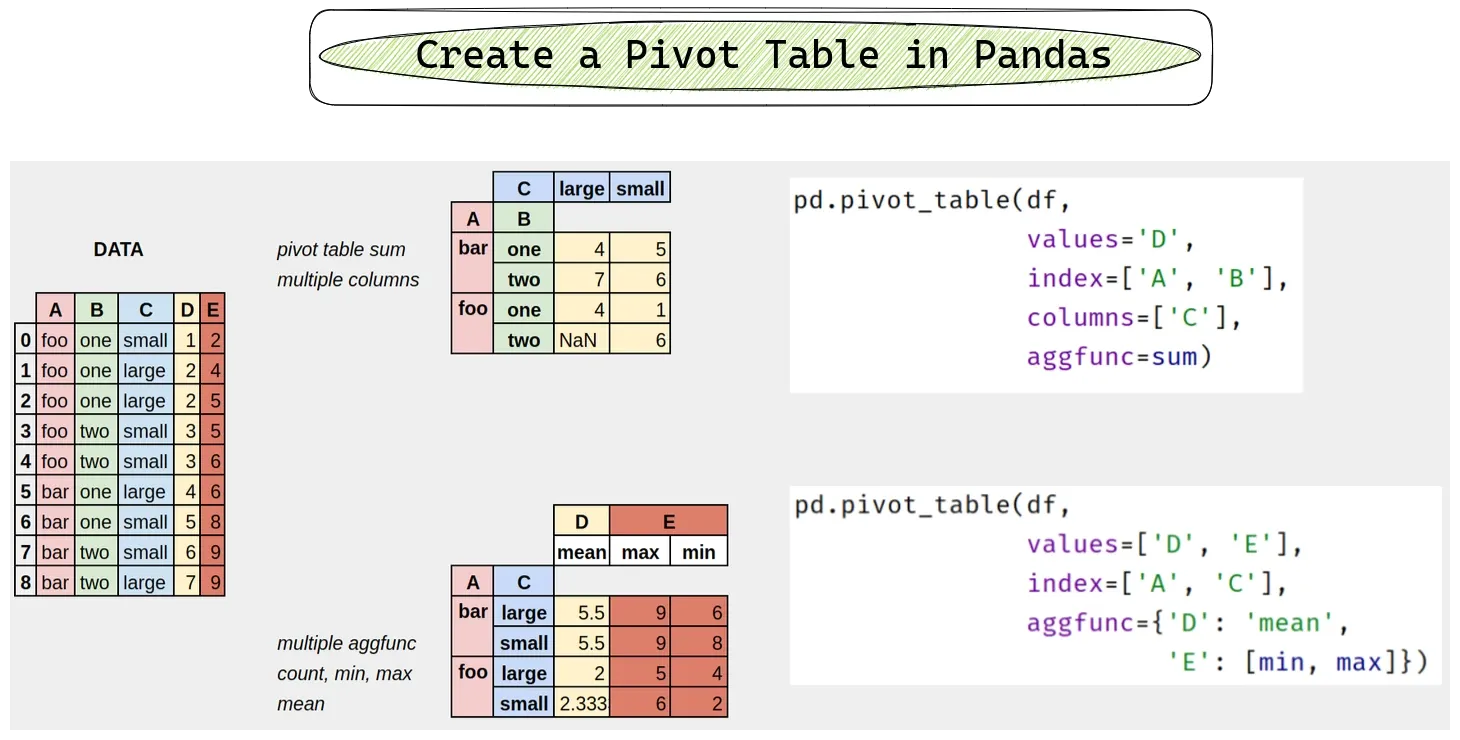
The main arguments you'll use are:
index: The column(s) to group by and display on the rows.columns: The column(s) to group by and display on the columns.values: The column(s) whose values will be aggregated.aggfunc: The aggregation function(s) to apply.
Let's watch a quick, practical demonstration.
Complete Python Pandas Data Science Tutorial! (2025 Updated Edition)
The 'Complete Python Pandas Data Science Tutorial!' video has a concise section on pivot tables that clearly demonstrates the core idea.
Watch from 01:08:22 to 01:10:31. The video uses a coffee sales dataset to show how to use pivot_table to see daily revenue broken down by coffee type. Notice how the index, columns, and values parameters work together to create the final shape.
A Deeper Dive into pivot_table
To really master pivot_table, let's walk through a more detailed article that builds up the complexity step by step.
The article 'Pandas Pivot Table Explained' from Practical Business Python is an excellent, clear guide. We'll go through its main sections.
Read through the article starting from the 'Pivot the data' section. Follow along with the code examples: 'Pivot the data': See how to create a simple pivot table with just an index, and then with multiple indices. values and aggfunc: Understand how to specify which column to aggregate (values) and how to change the aggregation function from the default mean (aggfunc). columns and fill_value: Learn how to add a second dimension of grouping with the columns parameter and how to clean up the resulting NaN values with fill_value. Advanced Aggregations: This is a key section. Pay attention to how you can pass a dictionary to aggfunc to apply different functions to different values columns. This is a very powerful feature.
A final powerful argument for pivot_table is margins=True, which automatically adds row and column totals (subtotals and grand totals) to your pivot table, which is extremely convenient for analysis.
groupby vs. pivot_table
So, when should you use which?
- Use
groupbywhen you need to calculate summary statistics and the output can be aSeries(one aggregation) or a DataFrame with a MultiIndex (multiple aggregations/groups). It is the most fundamental and flexible tool. - Use
pivot_tablewhen you want to reshape your aggregated data into a wide format that is easy for human eyes to read, similar to a spreadsheet. It's especially useful when you have two grouping variables that you want to see on the rows and columns of your output.
Essentially, pivot_table is a specialized application of groupby that handles the reshaping for you.
Conclusion
Excellent work! You've just learned one of the most important skills in data analysis. Being able to group and aggregate data is essential for uncovering patterns, calculating key metrics, and preparing data for more advanced analysis and modeling.
Key Takeaways:
- Data aggregation follows the Split-Apply-Combine strategy.
df.groupby()is the fundamental method for splitting data into groups based on column values.- You can apply aggregation functions like
.mean(),.sum(), and.count()to the grouped data. - The
.agg()method allows you to apply multiple functions at once, and even apply different functions to different columns. pd.pivot_table()is a powerful tool for both aggregating and reshaping data into a wide, spreadsheet-like format usingindex,columns, andvalues.
In our next lesson, we'll take our aggregated data and bring it to life. We will learn how to create static visualizations (line, bar, histogram, scatter) with Matplotlib. Visualizing data is the fastest way to understand distributions, relationships, and trends that you've started to uncover with aggregation.