Welcome to your first lesson. This course is designed to give you a solid foundation in the principles of epidemiological studies and survival analysis. We will start by building up the essential statistical vocabulary you'll need to understand and interpret research findings, which aligns with your goal of focusing on the practical meaning behind the numbers.
In this introductory lesson, we will explore the fundamental concepts of statistical inference: hypothesis testing, p-values, and confidence intervals. These are the tools that allow researchers to draw conclusions about an entire population based on data from a smaller sample. Mastering them is the first step toward critically evaluating the evidence presented in medical and public health studies.
The Logic of Scientific Evidence
In many data science and machine learning applications, we build models to make predictions. In epidemiology and clinical research, we often start with a more fundamental question: "Is there a real effect or difference, or did we just observe something by chance?" Statistical inference provides a framework to answer this.
The core idea is that we can never observe everyone in a population. Instead, we take a sample and use probability to make an educated guess, or inference, about the whole population.
Chapter 7 Confidence intervals and Hypothesis testing
To begin, let's get a formal introduction to the concept of statistical inference. Please read the section "Introduction to inference" in the provided text.
Read the two paragraphs under the heading 7.2 Introduction to inference. This will introduce the idea of using sample data to make statements about a population.
Hypothesis Testing: A Framework for Decisions
At its heart, scientific investigation is about challenging existing ideas. Statistical hypothesis testing gives us a formal structure for this process. It's a bit like a criminal trial: a defendant is presumed innocent until proven guilty beyond a reasonable doubt.
In statistics, the "presumption of innocence" is called the null hypothesis.
To get a clear, intuitive grasp of this framework, please watch the following video. It does an excellent job of explaining the core philosophy.
Statistical Significance and p-Values Explained Intuitively
This video, "Statistical Significance and p-Values Explained Intuitively" from the Galak Breaks It Down channel, introduces the logic of hypothesis testing using simple, powerful analogies.
Please watch the first part of the video, from the beginning to about the four-minute mark. Pay close attention to: The idea that science works by disproving ideas, not proving them. The analogy of the null hypothesis to the principle of "innocence until proven guilty".
As the video explained, we start with two competing statements:
-
The Null Hypothesis (): This is the default position, the "presumption of innocence." It states that there is no effect, no difference, or no relationship between the variables of interest. For example, a new drug has no effect on patient recovery time compared to a placebo.
-
The Alternative Hypothesis ( or ): This is what the researcher is trying to find evidence for. It states that there is an effect, a difference, or a relationship. For example, the new drug does change patient recovery time.
The goal of a study is to collect data and determine if there's enough evidence to reject the null hypothesis in favor of the alternative.
Hypothesis Testing, P Values, Confidence Intervals, and Significance
This article from the National Center for Biotechnology Information (NCBI) provides a concise, medically-focused overview of these concepts.
Read the section titled Hypothesis Testing. This will solidify the definitions of the research question, research hypothesis (alternative), and null hypothesis in a clinical context.
The P-Value: Quantifying the Evidence
Once we have our data, we need a way to measure how strong the evidence is against the null hypothesis. This is the role of the p-value.
A p-value answers a very specific question:
If the null hypothesis were actually true (i.e., there is no real effect), what is the probability of observing a result at least as extreme as the one we got in our study, just by random chance?
Let's break that down:
- A small p-value (e.g., 0.01) means it's very unlikely we would see our data if there was no real effect. This gives us confidence to reject the null hypothesis. The result is deemed statistically significant.
- A large p-value (e.g., 0.60) means our observed data is quite plausible under the null hypothesis. We don't have strong evidence against it, so we fail to reject the null hypothesis.
To make a decision, we compare the p-value to a pre-determined cutoff called the significance level, or alpha (). By convention, is almost always set to 0.05.
- If , we reject .
- If , we fail to reject .
The following video continues the excellent intuitive explanation of what a p-value represents and why the 0.05 cutoff is just a convention.
Statistical Significance and p-Values Explained Intuitively
Let's return to the "Statistical Significance and p-Values Explained Intuitively" video to understand the p-value itself.
Please watch from this section. It will explain: How to interpret a p-value in the context of a drug trial. Why the 0.05 threshold is a widely used but ultimately arbitrary convention.
This image provides a helpful visual. The curve represents the distribution of possible results if the null hypothesis is true. Our observed result falls far into the tail, in a region of "very unlikely observations." The shaded area corresponding to this result (and anything more extreme) is the p-value. Because this area is very small (less than the 5% threshold), we conclude the result is statistically significant.
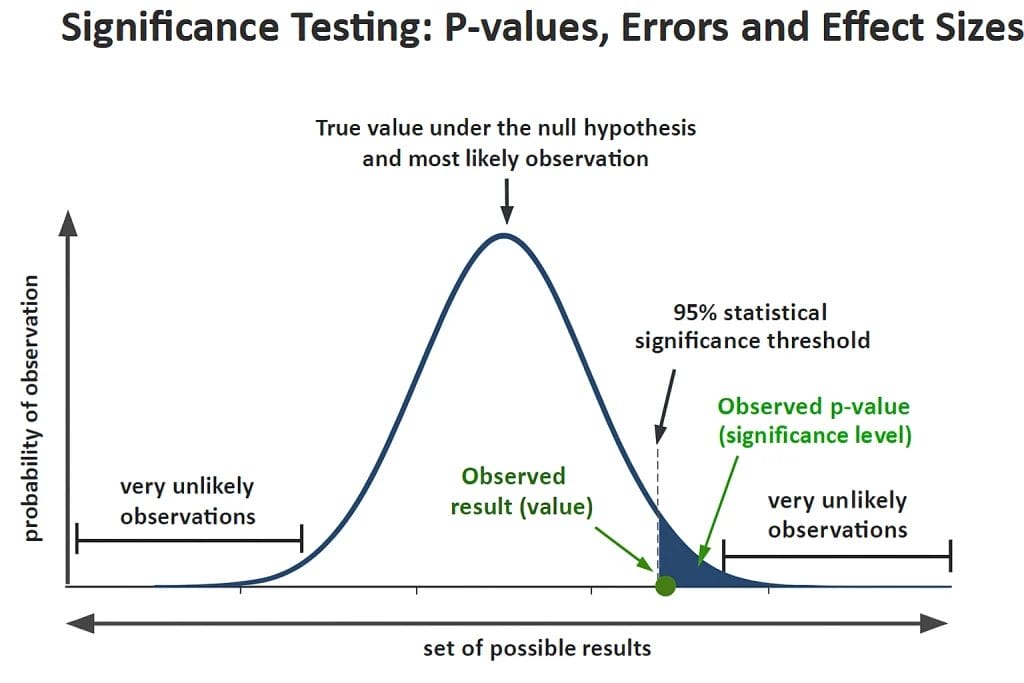
It is crucial to interpret the p-value correctly. A common mistake is to think the p-value is the probability that the null hypothesis is true. This is incorrect.
Chapter 7 Confidence intervals and Hypothesis testing
To reinforce the correct interpretation and learn about common pitfalls, let's read a more detailed explanation.
In the section "Level of significance \alpha and the p-value", focus on the subsection What is the meaning of the p-value?. It clearly states the correct definition and lists the three main problems with how p-values are often used.
Confidence Intervals: Estimating the Magnitude of the Effect
A p-value can tell you whether there is a statistically significant effect, but it doesn't tell you how big that effect is. This is a critical limitation. An effect can be statistically significant but too small to be practically meaningful.
This is where the confidence interval (CI) comes in. A CI provides a range of plausible values for the true population parameter we are trying to estimate (e.g., the average difference in recovery time between two drug groups).
The most common is the 95% confidence interval. The interpretation is subtle but important: If we were to repeat our study many times, we would expect the 95% CI to capture the true population value in 95 out of 100 trials. For a single study, we say we are "95% confident" that the true value lies within our interval.
The video below gives a clear, visual explanation.
Confidence Interval [Simply explained]
This video, "Confidence Interval [Simply explained]" by numiqo, breaks down what a confidence interval is, how it's calculated, and what the confidence level means.
Please watch the entire short video (5 minutes). It will walk you through: Why we need a range (an interval) to estimate a population value. The meaning of the 95% confidence level. The components of the formula for calculating a CI for the mean.
As the video explains, the formula for a 95% CI for a mean is typically:
You don't need to memorize this formula, but seeing its components is useful. Notice that a larger sample size makes the denominator bigger, which makes the overall interval narrower. This makes sense: more data gives us a more precise estimate.

Confidence intervals are incredibly useful because they show both the magnitude of an effect and its precision. A narrow CI suggests a precise estimate, while a wide CI suggests a lot of uncertainty.
Furthermore, a CI can also be used for hypothesis testing. For a difference between two groups (e.g., treatment vs. placebo), if the 95% CI does not include the value 0, the result is statistically significant at the 0.05 level. If it does include 0, the result is not statistically significant.
Hypothesis Testing, P Values, Confidence Intervals, and Significance
This reading explains the advantages of CIs over p-values for interpretation.
Please read the section titled Confidence Intervals. Focus on how a CI provides more information than a p-value and how you can use it to check for statistical significance (by seeing if the interval crosses 0 for a difference or 1 for a ratio).
Statistical Significance vs. Clinical Significance
This brings us to one of the most important lessons for anyone interpreting scientific literature. A result can be statistically significant without being practically or clinically important.
Imagine a new weight-loss drug is tested against a placebo in a study of 500,000 people. The results show that the drug group lost, on average, 0.5 pounds more than the placebo group over a year. Because the sample size is enormous, the estimate is very precise, and the p-value is tiny (e.g., p < 0.0001). The result is highly statistically significant. But is losing half a pound in a year clinically meaningful? Almost certainly not.
Conversely, a pilot study of a new cancer therapy on 20 patients might show a promising, large effect (e.g., a 30% improvement in survival), but due to the small sample size, the confidence interval is very wide and the p-value is not significant (e.g., p = 0.15). While not statistically significant, the potential clinical importance is huge and warrants a larger study.
Your judgment is key. This is where your goal to interpret results becomes paramount. You must look beyond the p-value and consider the size of the effect (the estimate), the precision of that estimate (the confidence interval), and the real-world context.
Hypothesis Testing, P Values, Confidence Intervals, and Significance
This final section drives home the distinction between statistical and clinical significance.
Please read the section on Clinical Significance. It emphasizes how healthcare providers must use their own judgment to evaluate the practical importance of research findings.
Conclusion
In this lesson, we've laid the groundwork for the rest of this course by introducing the core tools of statistical inference.
Here are the key takeaways:
- Hypothesis testing is a formal procedure for deciding if there's enough evidence in a sample to reject a default "no effect" position (the null hypothesis).
- The p-value measures the strength of evidence against the null hypothesis. A small p-value (typically < 0.05) indicates that the observed data would be surprising if there were truly no effect.
- The confidence interval provides a range of plausible values for the true effect size in the population. It is arguably more informative than a p-value because it communicates the magnitude and precision of the finding.
- Statistical significance is not the same as clinical or practical importance. Always examine the size of the effect (the estimate and its CI) in its real-world context.
These concepts are the foundation upon which statistical modeling is built. In our next lesson, we will look at our first statistical model, simple linear regression, and see how we use these principles to interpret the relationship between two variables.