In our last lesson, we focused on interpreting the output of a multivariable Cox model, learning how to understand the adjusted effect of each variable on the hazard of an event. This powerful technique allows us to isolate the impact of one factor while controlling for others, a concept central to both epidemiology and machine learning.
However, the validity of the hazard ratios we so carefully interpreted rests on a critical pillar: the proportional hazards assumption. This lesson is dedicated to understanding exactly what this assumption is and why it is the defining feature of the Cox model. Just as a linear regression model assumes a linear relationship between predictors and the outcome, the Cox model has its own foundational rule. Grasping this concept is essential for correctly applying and critiquing survival analyses.
The Core Principle: A Constant Hazard Ratio
At its heart, the Cox proportional hazards model gets its name directly from its core assumption.
Cox Proportional Hazards Model - Statistics By Jim
This article by Jim Frost provides a very direct and clear definition of the assumption.
Please read the section titled "Proportional Hazards Assumption". Pay close attention to the distinction between absolute risk and relative risk.
As the reading states, the proportional hazards (PH) assumption is that the hazard ratio between any two groups remains constant over time. The absolute risk for everyone in the study might increase or decrease as time goes on, but the relative risk (the hazard ratio) between a treated patient and a control patient, or between a male and a female patient, is assumed to be stable throughout the entire follow-up period.
The GraphPad guide offers another excellent phrasing of this same principle.
Analysis Checklist: Cox proportional hazards regression - GraphPad
This guide reinforces the definition and adds the important concept of a "baseline hazard function."
Read the first point on the checklist, "Are the hazard functions for each group proportional?". Note the idea that the hazard rate for any individual is just a scaled version of a single underlying baseline hazard.
This idea of a "scaled version" is key. The Cox model doesn't make any assumptions about the shape of the baseline hazard function, —it can be a complex, wiggly line. This is the "non-parametric" part of the model. However, it assumes that the hazard function for any individual with a specific set of covariates (e.g., male, age 50, on treatment) is simply that baseline hazard function multiplied by a constant factor:
Notice that the time variable, , only appears in the baseline hazard . The part that depends on the covariates, , is constant with respect to time. This mathematical structure is the formal expression of the proportional hazards assumption.
An Analogy to Other Regression Models
For someone with your background in information systems and interest in machine learning, it can be helpful to draw parallels to other regression models you may have encountered. The idea of a constant effect is not unique to Cox regression.
The following video does an excellent job of building this intuition by relating proportional hazards to the assumptions of linear and logistic regression.
Survival Analysis Part 9 | Cox Proportional Hazards Model
The presenter, from MarinStatsLectures, uses clear visual analogies to connect concepts you may already be familiar with to the proportional hazards assumption.
First, watch the initial explanation of the assumption from the beginning. The example of the hazard ratio for sex being a constant value of 2 is a perfect illustration. Next, watch the segment that draws analogies to linear and logistic regression. Focus on how the concept of a constant difference (linear regression) or a constant odds ratio (logistic regression) translates to a constant hazard ratio in survival analysis.
Let's summarize the analogy presented in the video:
- Linear Regression: In a simple model without interaction terms, we assume the difference in the mean outcome between two groups is constant. For example, the difference in average salary between two departments is the same regardless of an employee's years of experience.
- Logistic Regression: Similarly, we assume the odds ratio is constant. The odds of a customer churning if they are on "Plan A" versus "Plan B" is the same, regardless of their age.
- Cox Regression: The equivalent assumption is that the hazard ratio is constant over time. If a new drug cuts the hazard of death in half (HR = 0.5) compared to a placebo, the PH assumption means it cuts the hazard in half on Day 1, Day 100, and Day 500. The relative benefit doesn't change over time.
Visualizing Proportional vs. Non-Proportional Hazards
Visualizing what this means for the hazard functions can make the concept much clearer.
Survival Analysis Part 9 | Cox Proportional Hazards Model
This segment of the same video from MarinStatsLectures demonstrates the concept visually using plots of the log-hazard over time.
Watch the section from the visual explanation. The key insight is that under the PH assumption, the lines for the log-hazard of different groups should be parallel.
When hazards are proportional, their curves on a regular scale will move up and down together, maintaining a constant ratio. If you plot the logarithm of the hazard, the curves will be parallel—separated by a constant vertical distance. This constant distance is the log of the hazard ratio.
What does a violation look like? A violation means the effect of a covariate changes over time.
- Example 1: A surgery might dramatically reduce the hazard of death in the short term, but its benefit diminishes over years. The hazard ratio would be low initially but would approach 1.0 as time passes.
- Example 2: One treatment might be riskier at the beginning but offer better long-term survival than another.
A classic sign of non-proportional hazards is when the Kaplan-Meier survival curves for two groups cross.
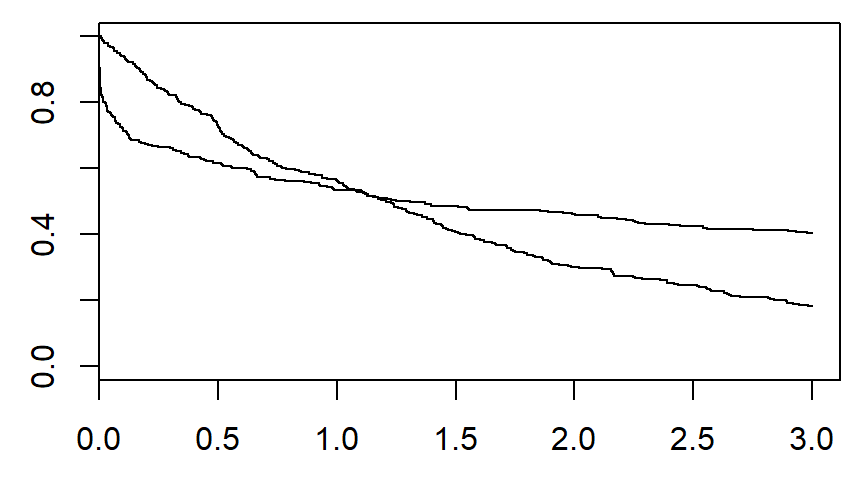
The TileStats channel provides a brief but clear verbalization of why this is a problem.
The Cox proportional hazards model explained
This video highlights how crossing survival curves indicate a violation of the assumption.
Watch the short segment from this explanation, where the narrator points out that if curves cross, it's hard to argue that the hazard ratio is constant.
If the survival curves cross, one group has a higher risk of the event for part of the study, and the other group has a higher risk for another part. A single, constant hazard ratio cannot possibly describe this changing relationship. The assumption is violated.
Other Assumptions of the Cox Model
While the proportional hazards assumption is the most defining one, it's not the only one. For context, it's useful to be aware of the others, though we won't detail them today. The GraphPad checklist you viewed earlier also lists these. The main ones include:
- Non-informative censoring: The reason a subject is censored (e.g., moved away, study ended) is not related to their prognosis.
- Independence of survival times: The survival time of one subject is independent of another's. This is a standard assumption in most regression models.
- Linearity for continuous variables: The effect of a continuous predictor is assumed to be linear on the log-hazard scale.
For today, the crucial focus remains squarely on understanding proportionality.
Conclusion
In this lesson, we have defined and explored the single most important assumption of the Cox model. Your interpretations of hazard ratios from the previous lesson are only meaningful if this assumption holds true.
Here are the key takeaways:
- The proportional hazards (PH) assumption states that the effect of any covariate on the hazard is constant over time.
- This means the hazard ratio comparing any two individuals or groups is stable throughout the entire follow-up period.
- Visually, this implies that the log-hazard curves for different groups are parallel, and their survival curves should not cross.
- A violation occurs when the effect of a variable changes over time, such as a treatment effect that wanes or a risk factor that only becomes relevant late in the process.
Now that we know what the proportional hazards assumption is and why it's so important, a critical question arises: how do we check if it's true for our data? In our next lesson, we will begin to answer that by exploring graphical methods used to assess the PH assumption.