Introduction
In our previous lesson, we established the principle of proportionality, which guides actuaries in making reasoned judgments about the appropriate level of detail and complexity in their work. We saw that a proportionate approach might involve using simplified models or working with imperfect data. This practical reality means that the output of any actuarial model is not a single, perfectly certain number, but rather an estimate subject to limitations and uncertainty. This brings us to the final, critical step in the modeling process: communication. An elegant model is of little value if its results are misunderstood, misinterpreted, or misused by decision-makers.
This lesson focuses on how to effectively communicate your model's results, paying special attention to its inherent limitations and uncertainties. As a statistician, you are intimately familiar with the concepts of variance, confidence intervals, and prediction error. The challenge for the actuary lies in translating these rigorous statistical ideas into clear, actionable insights for stakeholders who may not share your technical background. Our goal is to equip you with the frameworks and techniques to do just that, ensuring your work is not only technically sound but also genuinely useful.
The Foundation: Why We Must Communicate Uncertainty
The professional obligation to communicate uncertainty is not merely good practice; it is a core tenet of actuarial work. The aim is to ensure that anyone using actuarial information can rely on it. This is formally captured in what is known as the "Reliability Objective".
[PDF] Principles for Technical Actuarial Work - IFoA
This guidance from the Institute and Faculty of Actuaries (IFoA) establishes the professional standards for actuarial work. It provides the foundational reason for our discussion on communication.
Please read section 3, The Reliability Objective. Pay close attention to the final clause, as it sets the stage for this entire lesson.
The key phrase here is the need to include "the communication of any uncertainty inherent in the information." This means that expressing uncertainty is not an optional extra or an admission of failure; it is a mandatory and integral part of the output itself. Failure to do so could lead to a user placing false confidence in a model's output, potentially resulting in poor business decisions.
From Statistical Concepts to Business Language
To communicate uncertainty effectively, we first need a clear and intuitive way to think about it. While you are well-versed in the mathematics of probability, the challenge is to convey these ideas without resorting to technical jargon.
Uncertainty in Statistical Modeling Explained Intuitively
This video from the channel Galak Breaks It Down provides an excellent intuitive explanation of uncertainty, confidence, and precision using a simple dartboard analogy. While the statistical concepts will be familiar to you, focus on the language and analogy used to explain them to a general audience.
Please watch the video from the beginning to set the stage. Then, watch the core explanation of uncertainty as spread. Pay close attention to the distinction made between confidence and precision. Finally, watch the segment explaining how uncertainty and confidence level combine to define a prediction range, and the summary that ties it back to statistical modeling.
The dartboard analogy powerfully illustrates several key concepts you must be able to explain:
- Uncertainty as a Range: A model doesn't produce "the" answer; it produces a range of plausible answers. The wider the spread of darts on the board, the higher the uncertainty.
- The Confidence-Precision Trade-off: This is a crucial concept. We can be highly confident in a very imprecise statement (e.g., "The hurricane will land somewhere in North America"). Conversely, a very precise prediction ("The hurricane will make landfall at this exact coordinate") carries very low confidence. Your job is often to help stakeholders find the right balance for their decision-making needs.
- Confidence Level as a Choice: The 95% confidence level is a convention, not a law of nature. The appropriate level of confidence depends on the decision being made. A decision with severe consequences for being wrong requires a higher level of confidence, which, as we've seen, will necessitate a wider, less precise range.
Tailoring Communication to the Audience
Effective communication is never one-size-fits-all. The content, style, and level of detail must be tailored to the audience. A report for a regulator will differ significantly from a presentation to the Board or a discussion with an underwriter.
We can broadly categorize stakeholders into internal and external groups, each with different information needs.
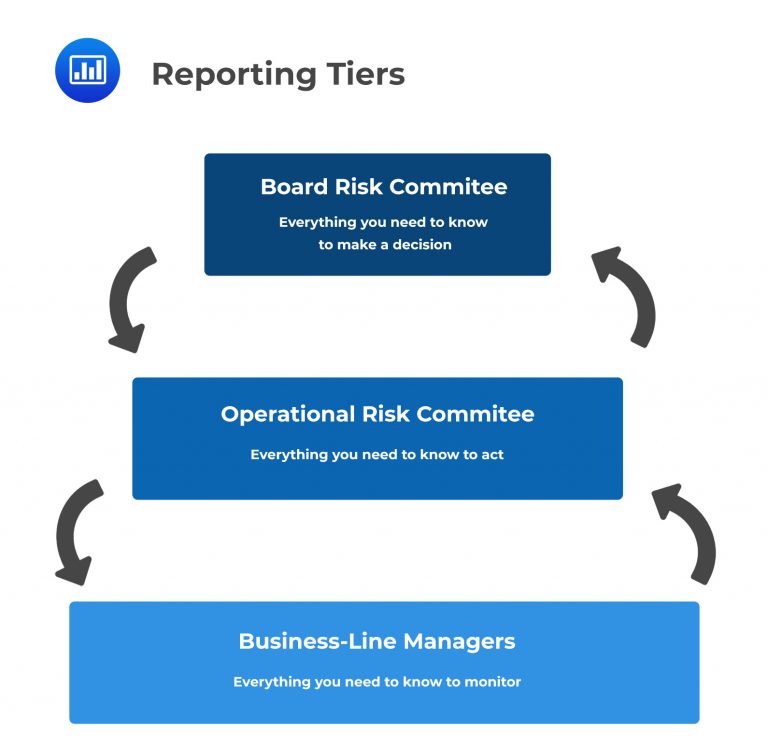
A working party from the Institute and Faculty of Actuaries has provided a useful guide on what to communicate and to whom.
[PDF] Session B4 The Effective Communication and Disclosure of Model ...
This presentation deck offers a practical framework for thinking about communicating model risk to different audiences.
First, review the slides on Internal Communications to understand the needs of stakeholders inside the firm. Then, look at the slides on External Communications to see how the message changes for those outside the firm.
Based on this, here's a summary of the key elements to communicate:
| Element to Communicate | Internal Audience (e.g., CRO, Head of Pricing) | External Audience (e.g., Shareholders, Regulators) |
|---|---|---|
| Scope & Purpose | Detailed explanation of what the model is and is not intended for. | High-level statement of the model's role in the business process (e.g., "used for pricing"). |
| Limitations | Specific technical limitations (e.g., "model does not capture policyholder lapse behaviour under stress"). | General statement on model limitations and the existence of a model risk framework. |
| Key Assumptions | Full list of material assumptions and the rationale behind them. | Summary of the most critical assumptions (e.g., "assumes an average investment return of 5%"). |
| Sensitivities | Detailed tables showing how outputs change when key assumptions are flexed. | A qualitative summary of key sensitivities (e.g., "results are sensitive to changes in interest rates"). |
| Data Quality | Specifics on any data issues, cleaning performed, and impact on results. | A statement of assurance that data has been validated. |
| Validation Status | Summary of internal and external validation findings, including outstanding issues. | Confirmation that the model is subject to a regular, independent validation process. |
Navigating Stakeholder Personalities
Beyond their formal roles, stakeholders are individuals with different cognitive styles and attitudes toward models. A powerful framework for understanding these differences uses two axes: concern for model uncertainty and the perceived legitimacy of modeling.

Let's break down how to approach each type:
-
Confident Model Users (High Legitimacy, Low Concern):
- Mindset: "Known Knowns." They trust the model and seek optimal, precise answers.
- Risk: They might ignore limitations and treat the model output as truth.
- Your Strategy: Don't just present the final number. Emphasize the key assumptions that the "optimal" answer depends on. Use sensitivity analysis to show how the answer changes if those assumptions prove wrong. Frame it as "The model recommends X, and this holds true as long as Y and Z are in these ranges."
-
Conscientious Modellers (High Legitimacy, High Concern):
- Mindset: "Known Unknowns." These are often your fellow technical experts. They are aware of model limitations and want to understand them fully.
- Your Strategy: You can be more technical with this group. Discuss the modeling choices made, the trade-offs involved (e.g., why you chose a simpler, proportionate approach), and the results of validation tests. The main challenge is to avoid "analysis paralysis" and ensure the discussion leads to a decision.
-
Intuitive Decision Makers (Low Legitimacy, Low Concern):
- Mindset: "Unknown Knowns." They trust their gut and experience ("market realities") over a "black box" model.
- Your Strategy: Do not lead with the model. Lead with their intuition. Frame the conversation around the business problem. Use the model to support, challenge, or provide a new perspective on their intuition. For example: "You've mentioned that you feel we are under-pricing this risk. The model suggests a similar conclusion, and it highlights that the main driver is the recent spike in claims from this specific region."
-
Uncertainty Avoiders (Low Legitimacy, High Concern):
- Mindset: "Unknown Unknowns." They are wary of models and highly concerned about what could go wrong. They seek robustness and safety.
- Your Strategy: Focus on risk mitigation. Use scenario analysis to present a range of outcomes, including plausible pessimistic scenarios. This addresses their concern for the unknown by making it more concrete. Explain how the model helps to quantify the potential impact of these risks, enabling the business to prepare for them.
Practical Application: How to Say It
Having the right framework is one thing; finding the right words is another. Let's look at some concrete examples of how to put these principles into practice.
A common situation is having to present results based on incomplete data or analysis, where you cannot be 100% certain.
How to Communicate with Stakeholders | Google Data Analytics Certificate
This clip from a Google Data Analytics course provides a simple but effective script for communicating a conclusion that is not fully proven by the data.
Watch the segment from "that the data tells you the stories". Note the specific phrasing the speaker uses: "I have a theory...", "Here's the proof points that I have that supports that theory...", "even though we weren't a hundred percent sure...we were confident enough to take action."
This simple example demonstrates a key skill: being clear about what the data suggests versus what it proves, and providing enough evidence to justify a business decision despite the residual uncertainty.
The professional guidance for actuaries is full of scenarios that reinforce these communication duties under various real-world pressures like tight deadlines, incomplete data, or complex group dynamics.
[PDF] Principles for Technical Actuarial Work - IFoA
Let's revisit the IFoA guidance to see how these communication principles play out in specific actuarial scenarios.
Please read the following three scenarios from the appendices: Scenario 5: Notice how the actuary must communicate model limitations and potential misinterpretations to senior management (the CRO and the Board). Scenario 6: Focus on how the actuary presents scenario results with a "clear narrative" and explains the limitations and residual risks. Scenario 13: Observe the priority of communication. The actuary must inform the underwriter of data limitations and their impact before the decision is made, even under extreme time pressure.
These scenarios reinforce a consistent theme: your duty is to ensure the user of your work understands its context, limitations, and the uncertainty of the results, enabling them to make a well-informed decision.
Conclusion
This lesson concludes our module on modeling and data. We have journeyed from the purpose of models, through the practicalities of data quality and the principle of proportionality, to this final, crucial step of communication. The central message is that a model's output is not the end of the story; it is the beginning of a conversation with a stakeholder.
Effective communication of model results is a blend of technical honesty and audience awareness. It requires you to translate statistical concepts into business-relevant insights, to be transparent about limitations and assumptions, and to tailor your message to the person receiving it. By mastering this skill, you transform your technical analysis from a complex calculation into a powerful tool for strategic decision-making.
Looking ahead, our next module will delve into Assumption Setting and Analysis. This is a natural progression, as the assumptions you choose—about mortality, expenses, investment returns, and more—are the primary drivers of the model uncertainty that you must so carefully communicate.
Key Takeaways & Cheatsheet
Here is a framework for structuring your communication about model results.
| Communication Principle | Guiding Questions for the Actuary | Example Phrasing for Stakeholders |
|---|---|---|
| Start with the 'Why' | What decision does this model inform? What is the core business question? | "We built this model to help us decide the right premium for this new product." |
| State the Conclusion First | What is the main message or recommendation from the model? | "Based on our analysis, we recommend a premium of £50 per month." |
| Explain the Key Drivers | What are the 1-3 most important assumptions or factors driving this result? | "This price is primarily driven by our assumptions about future claims costs and expected investment returns." |
| Quantify the Uncertainty | What is a plausible range of outcomes, not just a single point estimate? | "While our best estimate is £50, we are 90% confident that the required premium lies between £45 and £55." or "Our pessimistic scenario suggests a premium of £60 might be needed if claims are 20% higher than expected." |
| Be Explicit about Limitations | What does the model not do? What risks are not captured? | "It's important to note that this model does not account for the risk of a major catastrophe. That is a separate risk we manage through reinsurance." |
| Provide Actionable Advice | What should the decision-maker do with this information? | "We are confident enough in this range to proceed with the product launch, but we recommend closely monitoring early claims experience." |