Introduction
In our previous lesson, we established the fundamental requirements for data quality, defining the "what" of good data through the pillars of accuracy, completeness, and appropriateness. We saw that these are not just desirable attributes but core professional obligations for an actuary, essential for managing the input risk inherent in any model. Now, we shift our focus from "what" to "how".
This lesson will guide you through the practical, hands-on processes that actuaries use to achieve data quality. Our objective is to explain the processes of data verification, cleaning, and adjustment. You'll discover that this is not a one-time fix but an iterative cycle of investigation, correction, and process improvement. Given your background as a statistician, you'll recognize many of these techniques as direct applications of exploratory data analysis, now applied within the rigorous context of actuarial practice.
The Context: Data Governance and Integrity
Before diving into specific techniques, it's crucial to understand that data cleaning does not happen in a vacuum. These activities are part of a broader framework known as data governance, which establishes the rules, processes, and accountability for managing data as a corporate asset. Data management, in contrast, is the hands-on implementation of those rules.
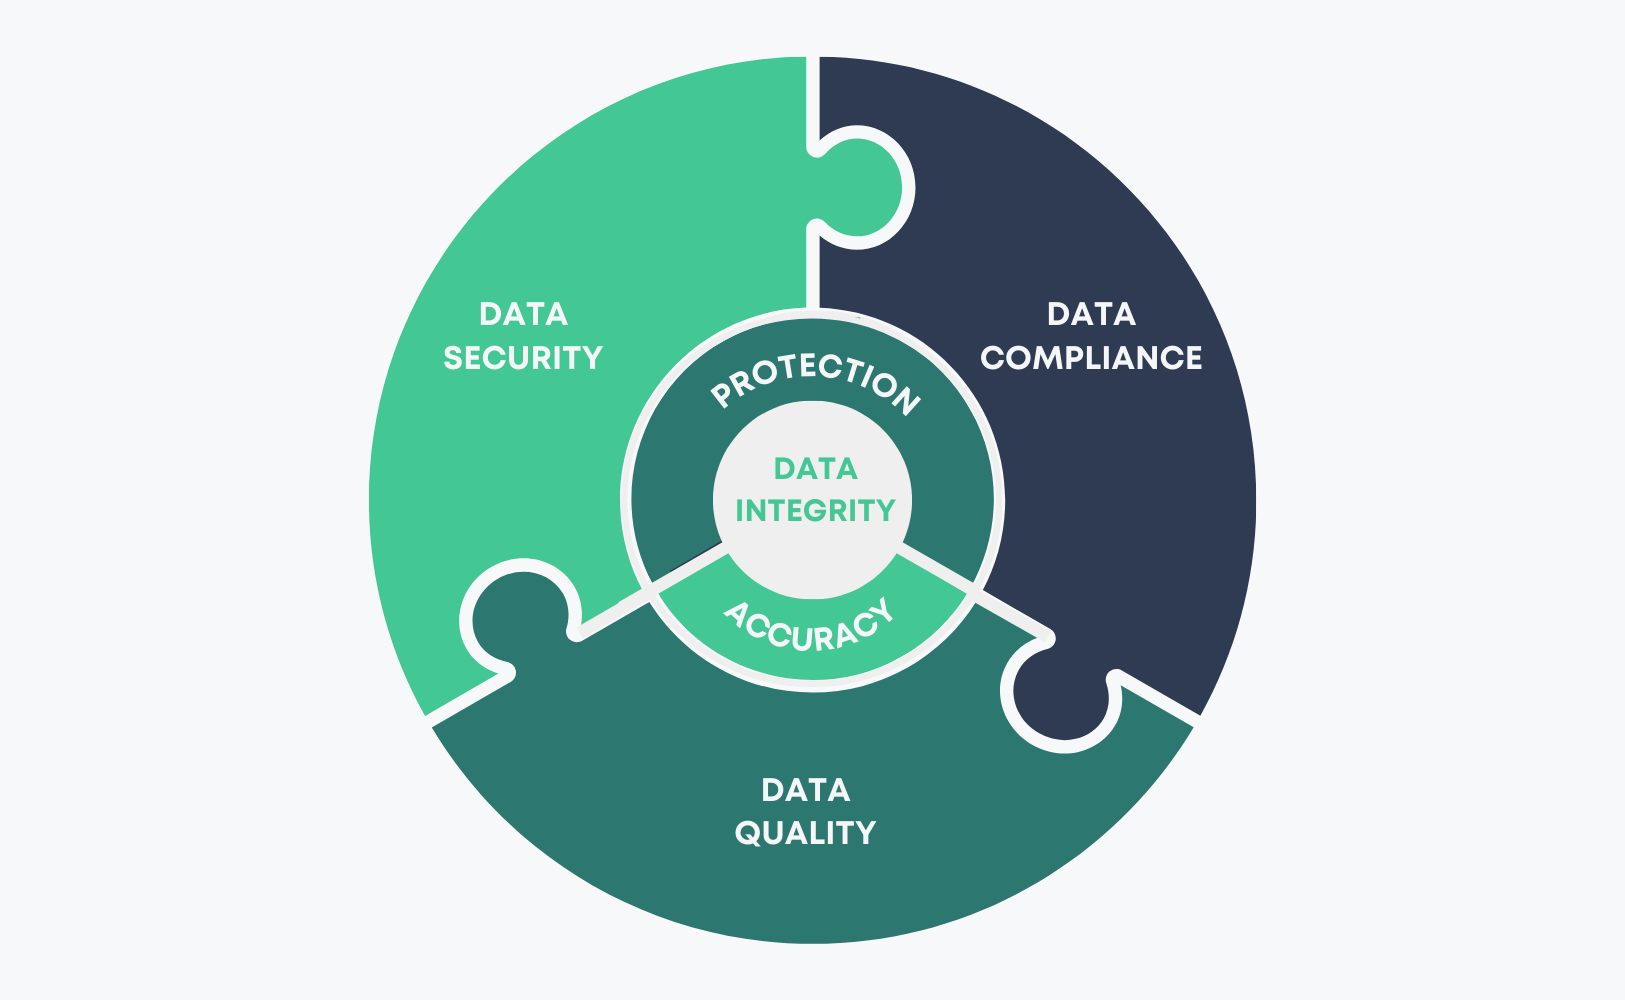
A core goal of data governance is to ensure data integrity. This concept goes beyond static quality at a single point in time; it refers to maintaining the accuracy and consistency of data throughout its entire lifecycle.
The video "Data Governance Tutorial" provides a clear distinction between data governance and management, and introduces the vital concept of data integrity.
First, watch the segment differentiating governance and management. This clarifies the strategic framework within which data cleaning operates. Next, watch the explanation of data integrity. The "telephone game" analogy is a powerful illustration of how data can become corrupted as it moves through systems and why continuous verification is necessary.
As the video highlights, without robust processes, data can degrade at each step of its journey. The verification, cleaning, and adjustment processes we will now discuss are the primary tools for preserving this integrity.
A Practical Workflow for Data Cleaning
The journey from raw, "dirty" data to a clean, analysis-ready dataset follows a general, cyclical pattern. Let's begin by looking at some common examples of data issues and the high-level workflow for addressing them.
What is Data Cleaning? | Data Fundamentals for Beginners
The video "What is Data Cleaning?" by Alex The Analyst offers a great visual introduction to the types of errors we encounter and the steps to fix them.
First, watch the definitions and initial examples from the introduction. Then, review the catalog of dirty data examples, such as punctuation issues, missing data, and messy structures. Finally, observe the data cleaning cycle presented. This provides a useful mental model for the process: import, merge, rebuild, standardize, deduplicate, and verify.

This cycle provides an excellent framework for our discussion. Let's break down its key stages into two main activities: Verification (finding the problems) and Cleaning/Adjustment (fixing the problems).
Part 1: Verification — Finding the "Dirt"
Verification is the investigative phase where you scrutinize the data to identify anomalies, errors, and inconsistencies. The primary toolkit for this is Exploratory Data Analysis (EDA), a set of methods that use descriptive statistics and graphical tools to understand a dataset's structure and uncover potential issues.
[PDF] Actuarial I.Q. (Information Quality)
The paper "Actuarial I.Q." from the Casualty Actuarial Society provides an actuary-specific guide to these techniques. We'll focus on the section dedicated to EDA.
Please read the section on Exploratory Data Analysis. This covers the use of data cubes (pivot tables), descriptive statistics, and box-and-whisker plots to screen data for quality problems.
Building on these techniques, we can categorize verification checks into several key types.
Types of Verification Checks
A systematic approach to verification involves applying a range of checks to identify different kinds of problems.
[PDF] A framework for applying data science techniques to health and care ...
This paper from the Institute and Faculty of Actuaries offers a detailed, modern framework for data cleaning, which is highly relevant.
Read the section on Data cleaning. Focus on the descriptions of structural issues, content issues, and the table of consistency checks. Pay close attention to the discussion of the different types of missing data (MCAR, MAR, MNAR).
As detailed in the resources, verification involves checking for:
-
Structural Issues:
- Duplicates: Duplicate rows (e.g., the same claim transaction entered twice) or duplicate entities (e.g., the same policyholder appearing with two different ID numbers).
- Incorrect Variable Types: A date stored as text, or a numerical value containing characters (like the 'l' instead of a '1' in the phone number from the video).
- Redundant Columns: Unnecessary columns that add complexity.
-
Content Issues:
- Missing Data: Fields that are empty or contain null values.
- Outliers and Implausible Values: Values that fall far outside the expected range. For example, a policyholder age of 150 years, or a negative premium amount. Descriptive statistics (min, max, mean) and box plots are key tools here.
- Inconsistent Data: The same entity having different values in different places (e.g., "New York" vs "NY").
-
Consistency and Logic Checks:
- Temporal Logic: Checking that dates follow a logical sequence (e.g.,
Date of Birth<Policy Start Date<Date of Claim<Date of Death). - Demographic Plausibility: Ensuring data aligns with logical constraints (e.g., only females have claims for ovarian cancer).
- Cross-Variable Consistency: Checking that values across different fields are coherent (e.g., a policyholder listed as a "non-smoker" should not have a claim for a smoking-related illness). Your experience in social research, where you might check for consistency between a respondent's marital status and their answers about spousal income, is a perfect parallel.
- Temporal Logic: Checking that dates follow a logical sequence (e.g.,
Part 2: Cleaning and Adjustment — Fixing the Problems
Once you've identified the issues, the next step is to clean and adjust the data. The appropriate action depends on the nature of the problem and its root cause.
Key Cleaning Processes
- Standardization: This involves transforming data into a consistent format. Examples include converting all state names to a standard two-letter code, ensuring all dates follow a
YYYY-MM-DDformat, or cleaning up name variations (Alex Freeberg,Alexander Freeberg,Alex F.) into a single, standard name. - Deduplication: This is the process of removing the duplicate records identified during verification.
- Correction: If an error's root cause is known and the correct value can be determined (e.g., by checking an original source document), the data can be corrected directly.
Handling Missing Data and Outliers
Dealing with missing data and outliers is more complex and requires careful judgment, as mishandling them can introduce bias. As a statistician, the concepts of data missing at random will be familiar to you.
-
Missing Data Mechanisms (as described in the IFoA paper):
- Missing Completely at Random (MCAR): The missingness is unrelated to any variable. This is the least problematic type.
- Missing at Random (MAR): The missingness is related to other observed variables. For example, younger people may be less likely to report their income. You can potentially correct for this using the observed age data.
- Missing Not at Random (MNAR): The missingness is related to the unobserved value itself or other unobserved factors. For example, people with very high incomes might be less likely to disclose them. This is the most difficult type to handle and is very likely to introduce bias.
-
Adjustment Techniques:
- Exclusion/Deletion: The simplest method is to delete records with missing values. This is only acceptable for MCAR and if the number of missing records is small, otherwise it can significantly reduce statistical power and introduce bias.
- Imputation: This involves replacing missing values.
- Simple Imputation: Using the mean, median, or mode. This is easy but can distort the data's distribution and correlations.
- Advanced Imputation: Using statistical models like Multiple Imputation by Chained Equations (MICE) or machine learning algorithms (
missForest) to predict the missing values based on other variables. These methods are generally preferred as they better preserve the data's underlying structure.
- Creating a New Category: For categorical variables, you can treat "missing" as a separate category (e.g., "Unknown"). This can sometimes be informative in itself.
From Reactive Cleaning to Proactive Improvement
So far, we've focused on data cleansing—reactively fixing errors in a given dataset. This is a necessary but costly process. The ultimate goal is to move towards a proactive strategy of re-engineering the underlying business processes to prevent errors from occurring in the first place.
[PDF] Actuarial I.Q. (Information Quality)
This paper also makes the crucial distinction between fixing data and fixing the process that creates the data.
Read the section on Data Quality Improvement Strategies. This will solidify your understanding of the difference between reactive data cleansing and proactive re-engineering.
This strategic shift from cleansing to prevention is at the heart of mature data management. It involves investigating the root causes of errors found during verification and implementing changes to systems, training, or controls to stop them from happening again. This creates a feedback loop where the cleaning process continually improves the quality of data at its source.
Conclusion
In this lesson, we have moved from the "what" to the "how" of data quality. You've learned that ensuring data is fit for purpose is an active, cyclical process of verification, cleaning, and adjustment. Verification involves using techniques from Exploratory Data Analysis to systematically identify structural, content, and logical issues. Cleaning and adjustment involve a range of solutions, from simple standardization to sophisticated statistical imputation for missing data.
Crucially, you've seen that while reactive data cleansing is essential, the long-term strategic goal is to use the insights gained from this process to re-engineer business processes and prevent errors at their source. This commitment to continuous improvement is a hallmark of a proficient actuary and is fundamental to maintaining data integrity across the organization.
In our next lesson, we will address a key practical consideration that governs all actuarial work: proportionality. We will explore how actuaries decide how much time and effort to invest in data cleaning and modeling, balancing the need for precision with practical constraints.
Key Takeaways & Cheatsheet
Here is a framework summarizing the processes of data verification, cleaning, and adjustment.
| Phase | Objective | Key Activities & Techniques | Examples |
|---|---|---|---|
| 1. Verification | Find the problems. | Exploratory Data Analysis (EDA): - Data Cubes / Pivot Tables - Descriptive Statistics (min, max, mean) - Visualisation (histograms, box plots) Systematic Checks: - Structural (duplicates, data types) - Content (outliers, missing values) - Consistency (temporal, logical) |
- Finding a policyholder age of 200.- Identifying that claim dates are earlier than accident dates. - Discovering 15% of postcodes are missing. |
| 2. Cleaning | Fix the problems (Reactive). | Standardization: Consistent formats and values. Deduplication: Removing duplicate records. Correction: Fixing errors with known correct values. |
- Converting all M, Male, 1 to a standard 'Male' code.- Correcting a typo in a policy number by checking the application form. - Removing a claim that was accidentally entered twice. |
| 3. Adjustment | Handle complex issues. | Imputation (for Missing Data): - Simple (mean/median) - Advanced (MICE, model-based) Outlier Handling: - Capping/Flooring - Transformation (e.g., log) - Exclusion (with justification) |
- Using a regression model to estimate missing income values based on age, occupation, and location. - Capping an unusually large claim amount at a threshold for a particular analysis to avoid distortion. |
| 4. Process Improvement | Prevent future problems (Proactive). | Root Cause Analysis: Why did the error occur? Re-engineering: Modifying the source system, process, or training to prevent recurrence. Automation: Building automated checks into the data pipeline. |
- After finding many invalid dates, adding a date-picker with validation to the data entry screen. - Implementing an automated alert that flags any new policy where the age is outside the range of 18-90. |