Introduction
In our last lesson, we established the critical role of the investment mandate in formalizing the relationship between an asset owner and their chosen manager. This mandate sets the rules of the game. Now, we must ask the inevitable question that follows: who won? This lesson transitions from instruction to evaluation, focusing on how we measure a manager's performance to determine if they have truly added value.
Our goal is to learn how performance measurement and attribution are used to evaluate investment outcomes. We will tackle the central question that every asset owner faces: was the manager's performance a result of genuine skill, or were they simply lucky enough to be in the right market at the right time?
To answer this, we will dissect performance into two key areas:
- Performance Attribution: We will explore models, like the Brinson-Fachler model, that break down a portfolio's excess return into its constituent parts—namely, the effects of asset allocation and security selection.
- Risk-Adjusted Measurement: We will examine key statistical ratios, such as the Sharpe and Sortino ratios, that move beyond raw returns to evaluate performance in the context of the risk that was taken to achieve it.
The Core Question: Skill vs. Luck
At its heart, performance evaluation is an exercise in separating a signal (manager skill, or alpha) from noise (market movements, or beta and random chance). As a statistician, you can think of this as a decomposition of variance problem. We want to attribute the observed return to its underlying drivers.
A concise guide from the Actuators Education Institute frames this perfectly.
CP1 Actuarial Practice - Actuators Education Institute
This short excerpt provides a succinct summary of how to monitor an investment manager, which is the essence of today's lesson.
Please read the paragraph under the heading How do you monitor an investment manager?. Note how it immediately distinguishes between "market movement (luck)" and "stock selection (skill)."
This distinction is the foundation of performance attribution.
Performance Attribution: Deconstructing Returns
Performance attribution analysis aims to answer the "why" behind a portfolio's return relative to its benchmark. It provides a structured way to understand the impact of a manager's key decisions.
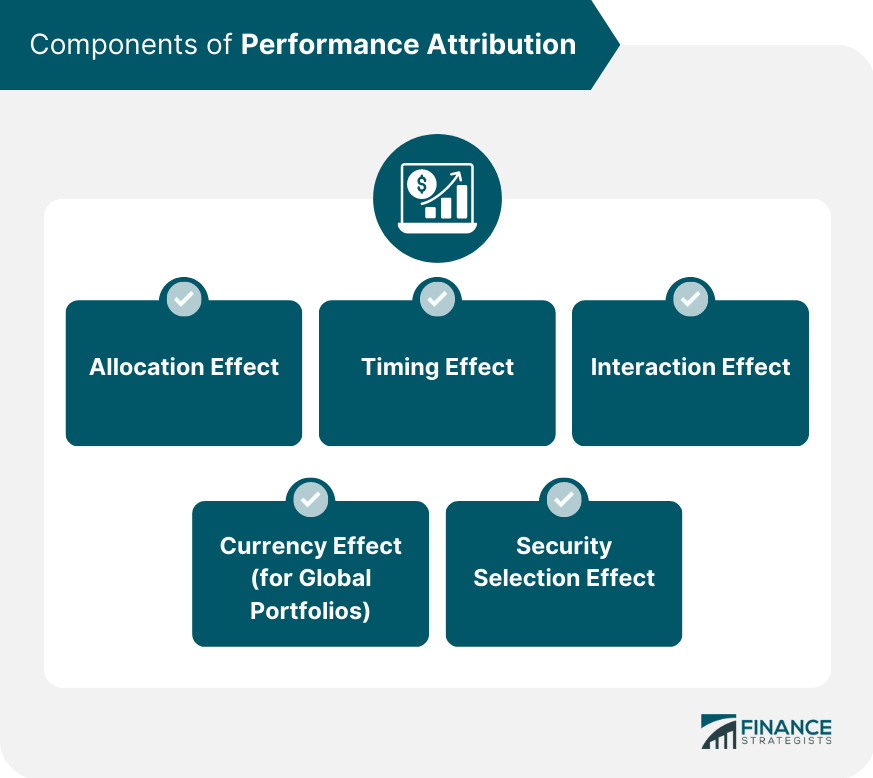
The most common framework for this is the Brinson-Fachler model, which decomposes the excess return into three primary effects.
Portfolio Performance Attribution: The Brinson-Fachler Model
The video "Portfolio Performance Attribution: The Brinson-Fachler Model" by Ric Thomas provides an excellent, clear walkthrough of this industry-standard model.
First, watch the introduction from the beginning to understand the model's purpose. Then, see how the initial excess return is calculated in the segment from the next section.
The model breaks down the total excess return (the difference between the portfolio's return and the benchmark's return) into the following components:
- Allocation Effect: Measures the impact of the manager's decision to overweight or underweight certain sectors or asset classes relative to the benchmark. A positive allocation effect means the manager successfully tilted the portfolio towards the better-performing parts of the market.
- Selection (or Stock-Picking) Effect: Measures the manager's ability to pick individual securities within each sector that outperform the sector's benchmark return. A positive selection effect indicates skillful stock picking.
- Interaction Effect: This is a cross-product term that captures the combined impact of allocation and selection decisions. For example, it measures the benefit of having good stock selection within the sectors that you chose to overweight.
To see how these are calculated and interpreted in practice, let's return to the video.
Portfolio Performance Attribution: The Brinson-Fachler Model
This video provides a step-by-step numerical example that brings the theory to life.
Please watch the following segments carefully, focusing on the formula and the intuition for each effect: Allocation Effect: This section shows how to isolate the value of the manager's sector weighting decisions. Selection Effect: This segment explains how to measure the value of the manager's security selection within each sector. Interaction Effect: Watch from this part to understand this more complex component. Summary: Finally, see how all the pieces fit together in the summary.
Interpreting an Attribution Report
In an exam or a real-world scenario, you won't be asked to calculate these effects from scratch. Instead, you'll be given an attribution table and asked to interpret it. The following video provides a perfect example.
Portfolio Performance Evaluation – Part II (2025 Level III CFA® Program – Reading 25)
The video "Portfolio Performance Evaluation – Part II" from AnalystPrep demonstrates how to analyze a pre-populated attribution table.
Watch the first example presented, concerning manager Sarah Thompson, from this segment. Pay close attention to how the presenter walks through the table, comparing the portfolio and benchmark weights and returns to understand the final attribution numbers. The key is to determine why the manager underperformed: was it due to poor country allocation or poor stock selection within those countries?
From this example, we can see the practical power of attribution. The manager's total underperformance of -0.72% was primarily driven by the selection effect (-0.67%), not the allocation effect (-0.05%). This tells us the manager's big-picture bets on which countries to be in were mostly fine; their problem was picking the wrong stocks within those countries.
Risk-Adjusted Performance Measurement
Attribution tells us why we got a certain return, but it doesn't tell us if that return was worth the risk taken. A manager who generates a 20% return might seem brilliant, but if they took on a terrifying amount of risk to get it, they may not be as skilled as a manager who earned 15% with much lower volatility. This is where risk-adjusted metrics come in.
These metrics are ratios that relate the return earned to the risk taken. A higher ratio is always better, as it indicates a better return for each "unit" of risk.
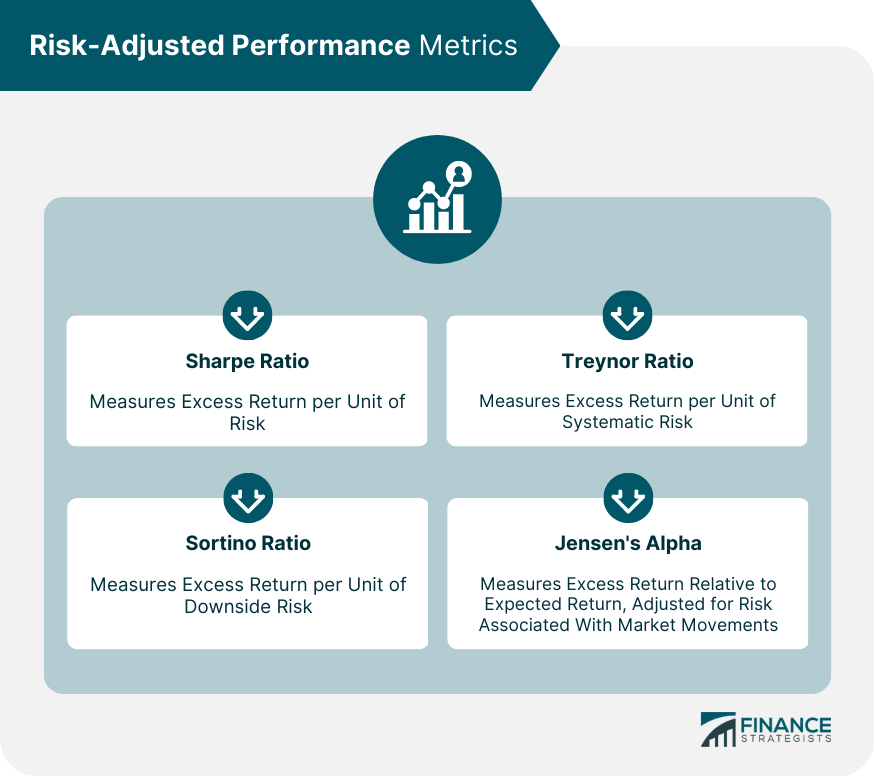
Let's break down these essential ratios.
-
Sharpe Ratio: This is the most common metric. It measures the excess return (above the risk-free rate) per unit of total risk (standard deviation).
Where is the portfolio return, is the risk-free rate, and is the portfolio's standard deviation. -
Treynor Ratio: This is similar to the Sharpe ratio, but it measures excess return per unit of systematic risk (beta). It is most useful for well-diversified portfolios where unsystematic (stock-specific) risk has been diversified away.
Where is the portfolio's beta. -
Sortino Ratio: Your background in probability theory might make this ratio particularly interesting. Unlike the Sharpe ratio, which penalizes both upside and downside volatility equally, the Sortino ratio measures excess return per unit of downside risk only. It argues that volatility to the upside is a good thing and shouldn't be penalized.
Where is the standard deviation of negative returns (downside deviation). -
Jensen's Alpha: This is not a ratio, but a direct measure of the return a manager generated above or below what would be expected from the Capital Asset Pricing Model (CAPM). A positive alpha indicates the manager added value.
Where is the market return.
The AnalystPrep video provides another excellent example of using these metrics to compare multiple managers.
Portfolio Performance Evaluation – Part II (2025 Level III CFA® Program – Reading 25)
This segment shows how to use a table of risk-adjusted metrics to draw conclusions about manager skill.
Watch the second example, which compares Manager A, B, and C, from this final clip. Notice how Manager A has the highest raw return, but also the highest risk. The risk-adjusted ratios (Sharpe, Treynor, etc.) confirm that Manager A is still the superior performer, as they generated the best returns for the level of risk taken.
The Cornerstone: A Proper Benchmark
All performance evaluation—both attribution and risk-adjusted measurement—is relative to a benchmark. If the benchmark is inappropriate, the entire analysis is meaningless. The qualities of a good benchmark are therefore a critical piece of knowledge.
Portfolio Performance Evaluation – Part II (2025 Level III CFA® Program – Reading 25)
This short clip outlines the essential characteristics of a high-quality benchmark.
Please watch from this section. As you watch, note down the seven key properties.
A common mnemonic for these properties is SAMURAI:
- Specified in advance
- Appropriate
- Measurable
- Unambiguous
- Reflective of current investment opinions
- Accountable
- Investable
Choosing an appropriate benchmark can be especially challenging for alternative investments like hedge funds or private equity, which often lack transparency, liquidity, and investable indexes.
Conclusion
Today, we have equipped ourselves with the tools to critically evaluate an investment manager's performance. We've learned that this is not a simple case of looking at a single return figure. Instead, it's a two-part investigation.
First, we use performance attribution to decompose the excess return and understand its sources. This helps us answer why the manager achieved their results, separating the impact of their allocation decisions (market timing) from their selection decisions (stock picking).
Second, we use risk-adjusted metrics like the Sharpe, Treynor, and Sortino ratios to put the raw return into context. These measures help us answer how good the performance was, given the level of risk the manager assumed.
By combining these two approaches, an asset owner can move beyond simple outcomes and build a sophisticated, evidence-based view of a manager's true skill, helping them make better decisions about who to hire, retain, or fire.
In the next module, we will step back from the specifics of investment performance and look at the broader topic of Actuarial Modelling. The attribution and risk models we discussed today are just one application of the modelling principles that are fundamental to all areas of actuarial practice.
Key Takeaways & Cheatsheet
Here is a summary of the key performance evaluation frameworks for your CP1 exam revision.
Performance Attribution: The Brinson-Fachler Model
| Component | Measures the Impact of... | Intuition |
|---|---|---|
| Allocation Effect | Over/under-weighting sectors vs. benchmark. | Did the manager correctly bet on which parts of the market would do well? |
| Selection Effect | Picking securities within sectors vs. sector benchmark. | Was the manager a good stock-picker within their chosen domains? |
| Interaction Effect | The combined effect of allocation and selection choices. | Did the manager's stock-picking skill add extra value in the sectors they chose to overweight? |
| Total Excess Return | Portfolio Return - Benchmark Return | Allocation + Selection + Interaction |
Risk-Adjusted Performance Metrics
| Metric | Formula | Interpretation |
|---|---|---|
| Sharpe Ratio | Excess return per unit of total risk. The higher, the better. | |
| Treynor Ratio | Excess return per unit of systematic (market) risk. Good for diversified portfolios. | |
| Sortino Ratio | Excess return per unit of downside risk. Only penalizes "bad" volatility. | |
| Jensen's Alpha | The return achieved above the CAPM-predicted return. A direct measure of value-add. |